Sales trend analysis looks at how sales perform over a week, year, or month. When performing a sales trend analysis, you understand if your sales are decreasing or increasing compared with previous periods.
This article will walk you through a detailed overview of sales trend analysis and how to implement it the right way.
What is Sales Trend Analysis?
Sales trends analysis refers to collecting sales data over a period of time from multiple sources and comparing it with previous timeframes to identify patterns and project future trends. Simply put, sales trends analysis allows you to use what has already happened in the past to predict what will possibly happen in the future.
Purposes of Sales Trend Analysis
Done well, sales trend analysis is a great practice to improve your business. It’s because this analysis shows you:
- Areas where your sales process is generating a lot of sales, sales reps who are performing best, or proposal writing practices that are high converting, so you can duplicate those successes.
- Areas where your sales team is underperforming, stages where you’re losing opportunities, or activities that are taking your sales reps a lot of time to accomplish but not contributing much to revenue growth. From that, you can build out proper strategies to change situations.
- A clear picture of your revenue growth and business performance year over year or month over month, which helps inform your sales forecasting.
How to Analyze Sales Trends
Follow these steps to start analyzing your sales trends:
Step 1. Review Key Performance Indicators (KPIs)
When choosing which KPIs or metrics to track and review for trends, you might want to consider the following:
- Sales operations metrics like average sales cycle length, cost per lead, average lead response time.
- Sales analytics metrics like sales growth, average purchase value, sales by product, sales to date.
- Sales performance metrics like win rate, average deal size, revenue, pipeline value.
- Sales engagement metrics like page views, ebook download, newsletter signups, demo requests.
- Sales activities metrics like calls made, emails sent, proposals submitted, the number of new leads.
Step 2. Compare Current Metrics With Previous Ones to Develop Insights
Revenue intelligence platforms like Revenue Grid provide a comprehensive sales dashboard that gives you everything you need to understand how your sales team is performing at any time. Use those dashboards to compare with current sales data and then answer the following questions:
- What are current B2B sales trends? How does each trend affect your business?
- How is your current sales performance? Is there any inflation or deflation? Does it happen regularly or just a few times across the observed timeframe?
- What do you see from closed deals? Are there any common characteristics among those successful deals?
- What are the bestselling products or services? How many of them did you sell last year or month?
- How are your competitors doing? Have they done anything differently from you?
Once you’ve acquired the insights you need, you’re ready to create a sales trend analysis report.
How to Write a Sales Trend Analysis Report
It’s one thing to know your data; presenting it so that relevant stakeholders can understand and act on it is another.
Here are some tips to help you write a sales trend analysis report effectively:
- Determine who will read your report and what they expect to know.
- Determine the tool you should use to present your findings, for example, Excel, PowerPoint, or a data visualization platform. This depends on your target audience.
- Choose the data and insights that match your target audience’s interests and needs.
- Write an executive summary of your report.
- For details on this matter, refer to this post: How to create Sales Reports.
Sales Trend Analysis Example
You need accurate data to ensure your sales trends analysis is meaningful and practical. This can’t be guaranteed if you collect data manually because it takes a lot of time and effort, not to mention missing data and wrong calculations.
That’s why you should adopt artificial intelligence-powered tools like Revenue Grid’s Team Analytics. With this tool, you can keep accurate sales records, analyze trends at critical decision points, maintain data integrity, and encourage team participation.
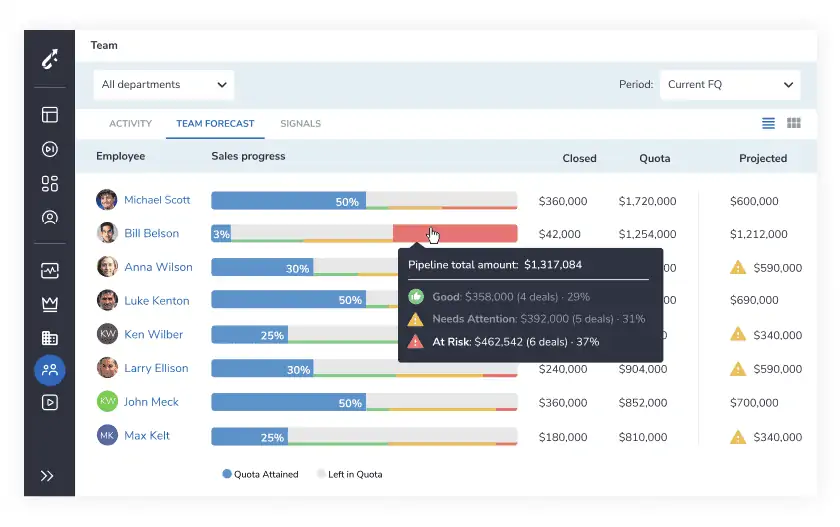
The best part? It also allows you to send real-time signals to your sales reps to alert them of the next best steps they should take to catch deals at risk before they go south.