More and more businesses rely on data to improve their sales and marketing performance. According to Kantar and Catalyst’s State of Ecommerce 2021 report, 56% of ecommerce professionals are allocating funds to data and analytics, making it the top ecommerce service budgeted for.
In a podcast, Mike Pregler, VP, Research Director at Forrester, also emphasizes that sales leaders are challenged by the boards to deliver a more predictable, consistent revenue stream. To achieve that, sales leaders need a well-developed, scientific process created by using data and technology. “That data and technology enables collaboration across the entire flow of the process, all the way from top-of-funnel interactions through the selling process through to the delivery and consumption,” he adds.
In this post, we’ll walk you through everything you need to turn sales data into revenue-generating actionable insights for your business. You’ll learn the importance of sales data, data collection sources, sales analysis techniques, and tools that help facilitate analyzing data.
What Is Sales Data?
Sales data refers to information extracted from various touchpoints and interactions between a customer and a business that benefits a sales team. The right sales data will help a sales rep understand prospects better, identify more opportunities, and win more deals.
Benefits of Sales Analysis
Sales analysis is the process of analyzing data and turning it into actionable insights that support decision-making. A thorough, comprehensive sales analysis is helpful not only to sales teams but also to non-sales departments.
Sales analysis reveals what customers need and expect to get from your business. It tells you about market opportunities, trends in sales performance, top-performing sales reps, high-converting sales activities, where you should allocate more resources, where risks can happen, and how you should forecast sales.
LinkedIn’s State of Sales 2021 report found that data is more crucial than ever for sales organizations, and it’s been used for a wide range of tasks, especially the five following:
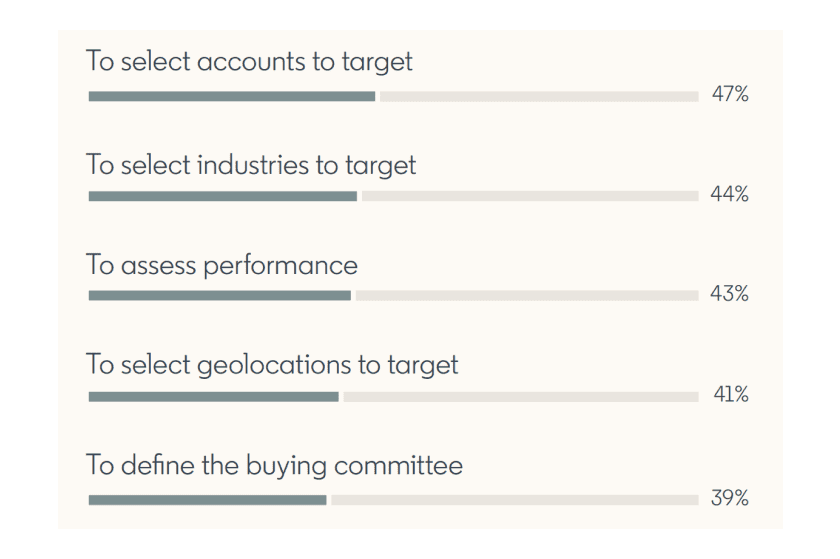
Sales analysis also creates value “for nearly every business function, from marketing to customer support to product and corporate strategy,” says Alyssa Merwin, LinkedIn VP of Sales Solutions, on Harvard Business Review. “Sales, Customer Support, Marketing, and Product teams can all benefit from insight into which accounts are poised for growth, which are ready for cross-selling, and which are likely to churn,” she adds.
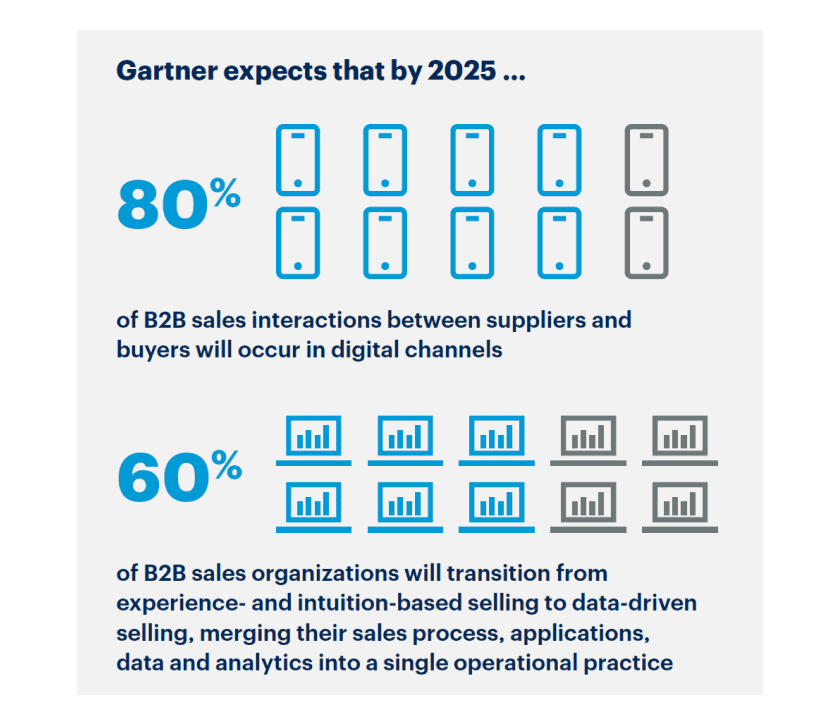
Gartner predicts that by 2025, 60% of B2B sales organizations will apply data-driven selling, and the future of sales is “the permanent transformation of organizations’ sales strategies, processes and allocation of resources, moving from a seller-centric to a buyer-centric orientation.”
The Most Valuable Metrics for Sales Data Analysis
Which metrics to track for a sales data analysis depends on your business goals, the industry you’re in, target audiences, and many other factors. There is no one-size-fits-all approach to this.
That said, businesses often consider metrics like conversion rate, win rates, sales length, average deal size, retention rate, and customer lifetime value to track performance. Check out this detailed guide to learn more about sales productivity metrics.
Sources for Collecting Sales Data
To collect sales data for analysis, consider the following sources:
- Your tech stack, including CRM, sales tools, revenue intelligence platforms, online meeting platforms, email marketing, Google Analytics, Facebook Analytics, and website.
- Surveys and interviews of your sales teams, non-sales departments, and your customers.
- Social networks and online communities, including posts, comments, shares, likes, brand mentions, and hashtags.
Sales Data Analysis Techniques
After gathering sales data, you can apply techniques to analyze it. The following are the most common sales analysis methods you can use:
1. Sales Trend Analysis
Sales trend analysis is meant for analyzing trends in sales data over a specific period like the past 24 hours, last week, last month, or last year. Trends can be upward, downward, steady, or periodically fluctuating.
When you adopt sales trend analysis, you look at historical statistics to identify patterns in revenue, sales reps’ performance, customer behaviors, and win-loss ratio. By doing that, you can determine opportunities and potential challenges to make timely decisions.
You can conduct a sales trend analysis by product collections, specific products, customer types, channels, regions, or even sales reps.
2. Sales Pipeline Analysis
A sales pipeline analysis refers to the process of analyzing your sales pipeline’s performance to understand why prospects succeed or fail at becoming actual customers. It tells you what’s happening throughout your sales process, what drives a prospect to take action, how many qualified leads you have, and how likely they convert.
With a sales pipeline analysis, you can always stay ahead of your sales operations and take immediate action to get opportunities or avoid deal failures.
When creating a sales pipeline analysis, you may consider metrics like the number of deals in each rep’s pipeline, the average size and value of the deals in each pipeline, the close-ratio, the average percentage of deals won, sales velocity, the average time it takes to win a deal.
3. Sales Performance Analysis
Sales performance analysis focuses on assessing the current state of your sales performance in comparison with your predetermined goals and industry benchmarks. It gives you a detailed picture of how your sales team is performing and if they achieve their sales goals.
In some cases, sales performance analysis also involves evaluating critical functions of a business, including sales, marketing, customer service, business operations, finance, and accounting. By bringing these departments together, you can clearly understand your business’s overall health and create strategic plans to sustain your growth.
4. Sales Diagnostic Analysis
If sales trend analysis tells you the patterns in your sales performance, then sales diagnostic analysis shows you the “why” behind those trends.
For instance, by conducting a diagnostic analysis, you discover that the number of calls a sales rep made in October was lower than in the previous months. This is because they had to spend a lot of time on administrative work, and they struggled with managing time.
After knowing the causes behind KPIs and sales trends, you can develop plans to improve the situation. In the example above, you can adopt a sales automation tool to help your sales rep automate repetitive tasks. You may also want to provide your sales reps with call scripts and training sessions to help them improve their cold calling skills.
5. Product Sales Analysis
A product sales analysis provides information about the sales performance of specific products. It’s critical if you’re selling multiple products and variants.
A product sales analysis helps you identify top-selling items and slow-moving items and compare product sales against each other. It also shows you what feature of a product interests customers and how you can leverage it to drive buying intentions.
6. Sales Effectiveness Analysis
A sales effectiveness analysis evaluates how well your sales team accomplishes their sales targets. It gives you answers to these questions: (1) did your sales reps achieve their goals over a period of time? And (2) how can you help them improve their performance?
When doing sales effectiveness analysis, businesses often use metrics like average new deal size, sales cycle length, and percentage of sales reps achieving quota. Some also focus on sales ramp-up time (i.e., the amount of time it takes a new sales rep to become fully trained from when they’re hired) and capacity hiring to get insights into onboarding processes and training investment.
7. Predictive Sales Analysis
A predictive sales analysis allows you to estimate your sales growth by detecting trends in customers’ and leads’ behavior. It uses historical data to analyze past performance and determine the possible outcome of sales activities.
Think this way: if you have an accurate prediction of what’ll happen in the future, you’ll have more control over what’ll happen to your business. That’s the core benefit of using a predictive sales analysis.
8. Sales Prescriptive Analysis
A sales prescriptive analysis tells you what actions you need to take based on actual data-derived intelligence, who has the highest chance of hitting their quota based on activity levels, and which opportunities have the highest potential.
According to Bain, “leading companies have begun to deploy prescriptive analytics—that is, guided actions on specific customers or prospect opportunities that flow from predictive insights. When applied to sales and marketing, prescriptive analytics can help companies improve the return on their investments, optimize conversion and win rates, or maximize profit margins.” With a sales prescriptive analysis, you become more proactive than reactive.
Analyze Sales Data With Sales Ops Software
Collecting and analyzing data is time-consuming, especially if you do it manually. But with a revenue intelligence platform like Revenue Grid, you can simplify your sales analysis process and get it done quickly.
Revenue Grid is a robust tool with a bunch of sales-focused features. So it’s no surprise that it offers built-in options for data analytics.
1. Team Analytics
Team Analytics is a Revenue Grid feature allowing you to get a bird’s eye view of all your sales reps’ activities.
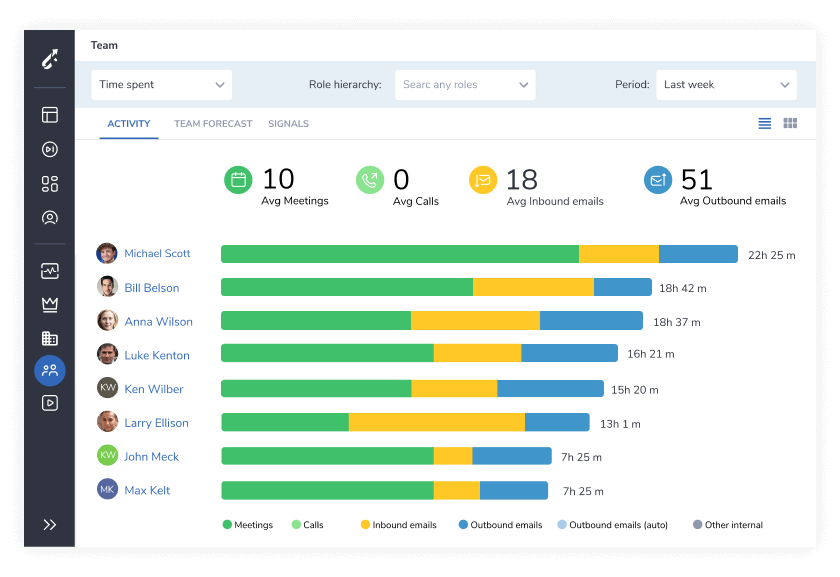
To make it work, just go to your Revenue Grid dashboard > Team Analytics and select the team reports you’d like to display on the dashboard. This can include:
- Activity: Track what your rep is doing, how many opportunities they need to take action, and how much time they spend on each activity.
- Team forecast: Identify whose forecasted pipeline is on track, stalling, or at risk.
- Signals: Create actionable signals that tell your reps the next best steps and help them focus on activities that improve efficiency.
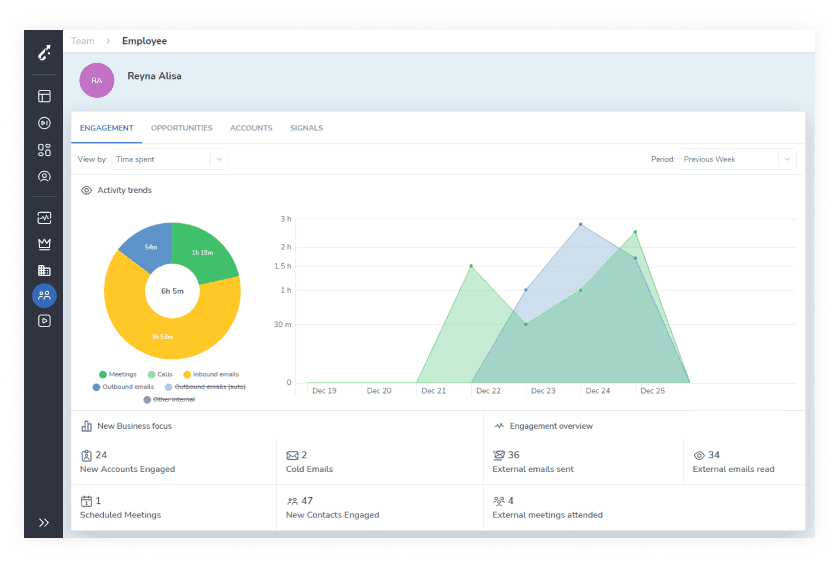
Apart from that, when you click on a sales rep profile, you’ll be directed to their activity details page which shows what they have been doing. You’ll see how much and on what specific day the rep had meetings, made calls, and sent emails. You can also view details of each activity, which are being pulled directly from email clients and calendars; no data is stored anywhere else.
2. Pipeline Visibility
Sales pipeline visibility is essential because, without it, your company can be dogged by inefficiencies and inaccuracies that can hinder your growth. Sales pipeline visibility empowers your sales teams with everything they need to make the most out of every opportunity and eliminate errors whenever possible.
With Revenue Grid, you can see what’s flowing into each sales pipeline in real time and which deals are moving, stalled, or at risk. You can also set up alerts on changes in deal size, close dates, and scores, which is impossible to do in traditional CRMs.
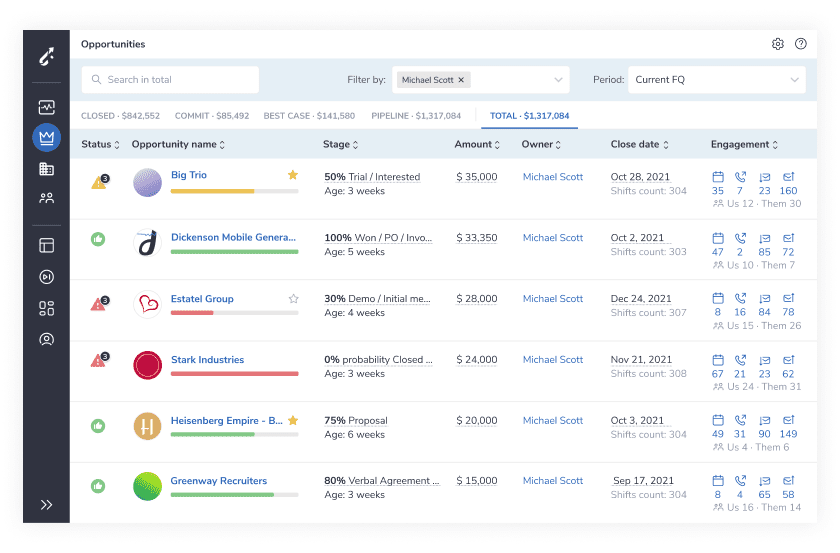
Last but not least, Revenue Grid provides you with AI-powered automatic data and activity capture. This way, you can access critical sales metrics for each deal without having to dive deep or inspect committed deals and understand what’s overpromised.
3. Deal Guidance
Deal Guidance allows you to shorten the sales lifecycle and guide sales reps to take the right action when it’s needed, where it’s needed. It offers AI recommendations and playbook suggestions to help your rep better communicate with prospects. They’ll learn what’s the right time to contact audiences, what message resonates with customers, and more.
According to Oracle, deal guidance is no longer a nice to have but a must for every sales team. When sales reps are given best practices and actionable insights, they can sell confidently and quickly. They can understand customer needs, craft relevant messaging, and prioritize actions that help convert the customers.
Final Thought
Spending more time collecting and analyzing sales data can bring you insights that will drive your top-and-bottom-line growth and improve your sales reps’ productivity. The sooner you refine your sales strategies based on data, the more opportunities you can see, and the more deals you can win.
Sign up for a Revenue Grid demo today, and our expert team will show you how it works for your business.