In a matter of decades, selling has gone from intuitive, face-to-face practice to data-driven science–with lots of moving parts and little room for error.
Add in the rise of digital media, big data, and all the COVID-induced chaos, and it’s no surprise that sales analysis metrics have become critically important to any sales strategy. They help orgs understand their customers, improve forecasting, and drive predictable sales outcomes–all of which means a big boost for your bottom line.
Below, I’ll break down the basics of sales analytics, go over which stats to track for sales, and share some tips for making the most of your sales analytics strategy.
What are sales analytics?
Sales analytics describes the practice of mining sales data and measuring performance against critical business objectives. It provides insights into rep performance, market trends, which products are selling (or not), why customers behave the way they do, and more.
Sales analytics typically break down into four main categories:
- Descriptive. Descriptive analytics tell you what happened. Think–how much revenue did each rep bring in last quarter? Or many leads became customers? Here, the goal is to provide an understanding of the situation—so you can identify patterns and areas for further investigation.
- Diagnostic. Diagnostic analytics tell you why something happened. For example, if team performance tanked last quarter, diagnostic analytics might point toward seasonal trends, low quality leads, or COVID lockdowns as the root cause.
- Predictive. Predictive sales analytics draw on historical outcomes to predict future outcomes and surface patterns or trends. Predictive analytics can improve forecasting accuracy, lead scoring, and prioritizing opportunities in the pipeline.
- Prescriptive. Prescriptive analytics takes things a step further. It uses predictive insights and develops a game plan for delivering the desired outcome. For example, prescriptive analytics might tell reps share a specific piece of collateral or follow-up on a certain channel, based on which actions are most likely to push deals closer to the finish line.
Sales analytics metrics to track
Sales analytics metrics should always provide targeted insights that enhance decision-making and sales performance. They shouldn’t distract reps or send them in the wrong direction.
Now, every business is unique. So, the metrics you choose to measure might look different than the ones other companies are tracking. For example, SaaS sales metrics are suitable for SaaS businesses, not ecommerce. But–it’s important to mention that regardless of differences between organizations, KPIs should bring clarity and focus to the strategy.
All that in mind, here are 12 sales analytics metrics that measure sales performance and drive meaningful improvements.
1. Sales growth
Sales growth represents how much revenue your team generates within a specific timeframe. This metric gives sales leaders a high-level view of team performance and tracks changes over time. It provides an instant pulse on the health of your business.
It’ll tell you if sales performance is stagnating, improving, or declining—then from there, you can dig deeper to find and fix root causes—at the source. Additionally, tracking sales growth can help you design better sales strategies and improve forecasting accuracy.
You can calculate sales growth by taking total sales for a specified quarter (or week, month, whatever), then subtracting the total sales from last quarter and multiplying by 100.
So, if your team brought in $200k last quarter and $250k this time around that’s a 20% growth rate.
2. Average purchase value
Average purchase value, also known as average deal size, measures the average value of each sale. This is one of the most important sales analytics KPIs as its central to revenue projections, forecasting, and developing a growth strategy.
You can find your average purchase value by dividing total revenue by the number of purchases made within a specified timeframe.
This metric serves as a baseline for understanding team performance. You can use it to figure out whether reps are on track to hit sales goals or falling short of expectations.
Depending on your findings, you might drill down to find answers to the following questions:
- Are reps taking too long to follow up?
- Are they missing out on upsell/cross-sell opportunities?
- Are they chasing big fish accounts instead of going after several smaller ones?
- Are reps aiming too low and not offering more expensive products/upgrades?
The list goes on, but the point is, average deal size is a good starting point for understanding and improving team performance.
3. Sales per rep
Sales per rep tracks individual performance and can be measured in terms of revenue generated or total transactions.This metric is useful for developing training & coaching programs, setting goals, and offering incentives for top-performers.
To track rep performance, all you’ll need to do is filter reports by either number of sales made or revenue generated within a specific timeframe.
If you’re using Revenue Grid, you can use visual sales analytics tools to identify individual performance–in context with the rest of the team.
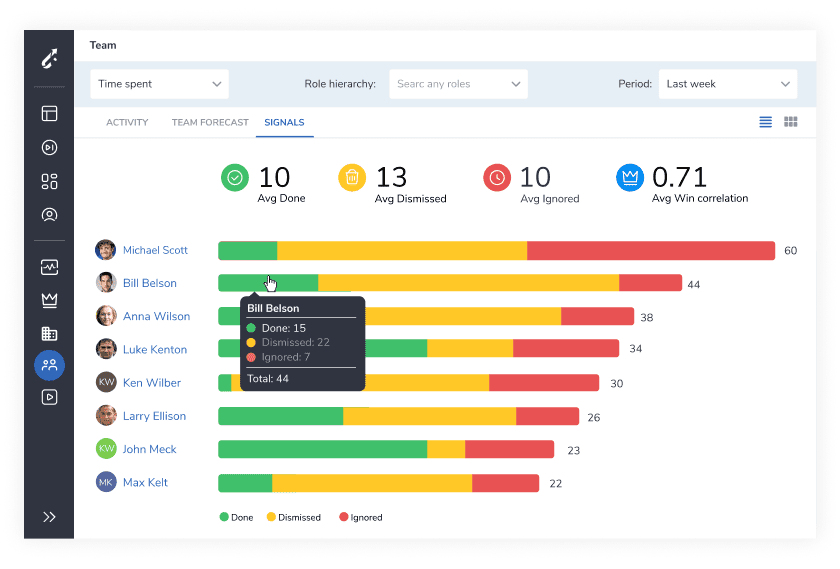
And, you can quickly assess the health of each rep’s pipeline:
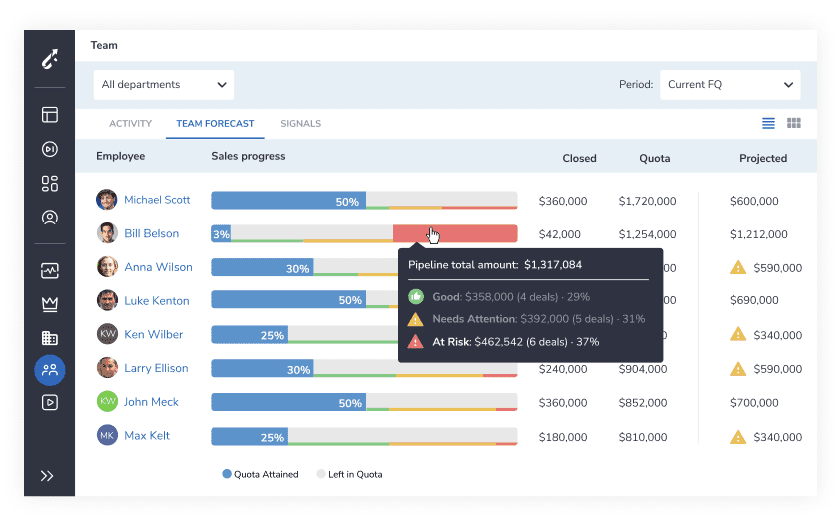
Note that while revenue matters more to the bottom line, the number of sales can tell you more about whether a salesperson’s tactics are working—or not. So, if you’ve got reps closing a ton of low-value deals, that might mean working with them to identify bigger deals to work. Or, helping them become more effective at upselling and cross-selling.
Alternatively, if the number of sales is low, you may need to focus on developing skills.
Additionally, it’s important to look at factors like vacation, sick days, and time spent on tasks that don’t generate business value.
4. Sales to date
Sales to date is one of the most important metrics in a sales analytics report. It measures the cumulative value of sales made during a specific period. This metric allows you to measure current sales performance against previous years, using the same set of dates.
Sales leaders can use this info to forecast trends and identify patterns–then work them into the big-picture plan. That way, they can bring in reinforcements when the seasonal rush hits. Or, perhaps take advantage of slow months to roll out training initiatives, introduce new tech, or break into new markets.
5. Sales by product
Sales by product measures the profitability of each product in your catalog or number of units sold. This metric matters because it reveals how products are performing. It helps you learn more about what buyers want—so you can make decisions about what stays, what goes, and what you might add to the catalog.
In some cases, it may make more sense to measure the number of units sold. For instance, if you’re trying to understand whether your audience is interested in low-cost add-ons/services, looking at how many people take advantage of those offers can help you decide whether they’re worth keeping around. Consider the impact on things like retention, renewals, or upgrades.
Additionally, sales by product can help you measure the impact of high-cost, low-volume products and low-cost, high-volume products on your pipeline. Then you can decide where reps can strike the right balance between locking in quick wins and chasing “whales.”
6. Sales by region
Sales by region tracks sales performance by geographic location–be it city, state, territory, or continent.
This metric allows you to identify which regions are performing best and which ones are struggling. That way, you can allocate resources like selling time and marketing dollars to the areas likely to yield the biggest returns.
It also allows you to examine the different factors that impact sales performance—including population density, seasonality, market demographics, etc. and incorporate them into your sales strategy.
7. Sell-through rate
Sell-through rate measures how much inventory was sold vs. how much was received from suppliers within a given timeframe. This metric can be used to improve supply chain efficiency and forecasting–allowing orgs to estimate how much product they can move within a given timeframe and make purchasing decisions based on their findings.
You can calculate your sell-through rate by dividing the number of units sold by the number of units received and multiplying by 100.
The higher the percentage, the better. If your sell-through rate is low, it suggests there’s a problem. It might mean you don’t understand your audience, the market, or the ebb and flow of seasonal trends. Or, it could be something else. In any case, you’ll need to dive deeper for further investigation.
8. Pipeline velocity
Pipeline velocity measures the speed at which leads move through your pipeline. It’s an important metric to track because it helps you predict how long it’ll take to make money on any given deal.
You can use the following formula to calculate pipeline velocity:
Number of qualified leads in the pipeline x average deal size x average close rate) / length of your sales cycle.
By the way, we explain how to increase sales velocity here, if you’d like to learn more.
9. Quote to close ratio
The quote-to-close ratio represents the total number of prospects your sales team engaged vs. how many of those prospects became customers. So, if your sales team spoke with 100 prospects in a month and 15 became customers, your quote to close ratio is 15%.
This ratio is used to gauge the effectiveness of your sales funnel and serves as a starting point for diagnosing where things went wrong.
So, you might start by calculating your overall quote-to-close rate, then drilling down by looking at close ratios stage-by-stage.
For example, that might mean starting at the beginning—how many leads became prospects? If the percentage is low, you might be targeting the wrong audience, and as such, you’ll need to get together with marketing to improve lead gen effectiveness.
Or, say there’s a sharp drop-off right before the close. In that case, you’ll want to look for factors that might cause prospects to put the deal on pause. Think annual budgets, acquisitions, financial losses, etc. You’ll also want to look at what sales reps are doing to overcome objections/position themselves as someone who can solve their problem. How, then, might you refine your approach to drive better outcomes?
10. Sales target
Sales target measures current sales performance against your big-picture business goals.
Sales target measures how much your team needs to sell to hit their sales goals. This metric can be measured in terms of units sold or a revenue generated–depending on what those sales goals are.
You can calculate sales target attainment using this simple formula:
(Total sales / sales target) x 100
This KPI allows you to set clear goals for your sales team, as well as establish incentives and bonuses when reps exceed those targets.
11. Total open opportunities
Something like 80% of leads never never become customers. Which means you need to keep a close eye on the pipeline to make sure that reps have a steady stream of qualified leads to work with at any given time.
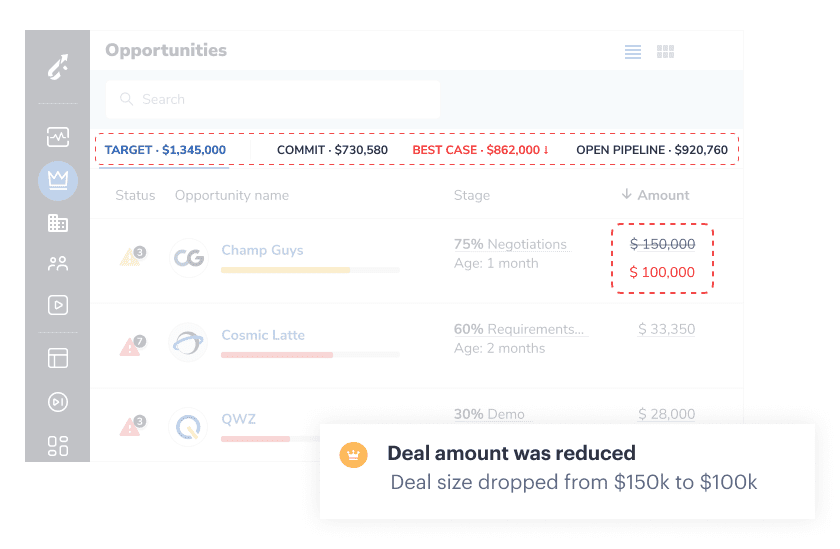
Tracking open deals helps you understand whether reps have enough deals in the pipeline to hit their targets–leaving some room for prospects to stall–or drop out of the funnel altogether.
If you’re using Revenue Grid, you might set alerts for changes in deal size, projected close date, or other signs action is needed.
12. Total closed opportunities
While monitoring open deals can tell you whether your reps have enough opportunities to hit their targets, that metric won’t tell you whether your sales process is effective–or needs some help.
Tracking the amount of opportunities that result in a sale is an important step toward driving improvements. It might be used to score future opportunities, understand the “why” behind losses, and take action before deals go off the rails.
How to improve sales analytics effectiveness
Now that we’ve gone over some metrics you might work into your sales analytics dashboard. Here are some ways to improve your sales analytics strategy:
Create a hyper-connected digital ecosystem
Using data to improve sales performance requires end-to-end visibility throughout the entire business. That means, everything from your CRM and collaboration tools to your sales analytics software and financial reports must come together in one centralized hub.
Hyper-connectivity is crucial for effective sales operations. It enables alignment between different departments. For example, sales, marketing, and customer success can all work together to ensure a consistent experience across all touchpoints.
That tight connectivity also makes it easier to put insights in context. For example, you might track team analytics against external forces like seasonal trends, regulatory challenges, or the uncertainty caused by new COVID variants.
It also enhances sales forecasting capabilities–enabling orgs to assess risks and take proactive steps toward mitigation.
AI and automation must become critical priorities
Look, sales analytics are worthless without AI.
There are too many data points, variables, and touchpoints that might possibly influence sales outcomes. It’s just not possible for humans to consume that much information—much less interpret it with the speed and accuracy needed to carve out a competitive edge.
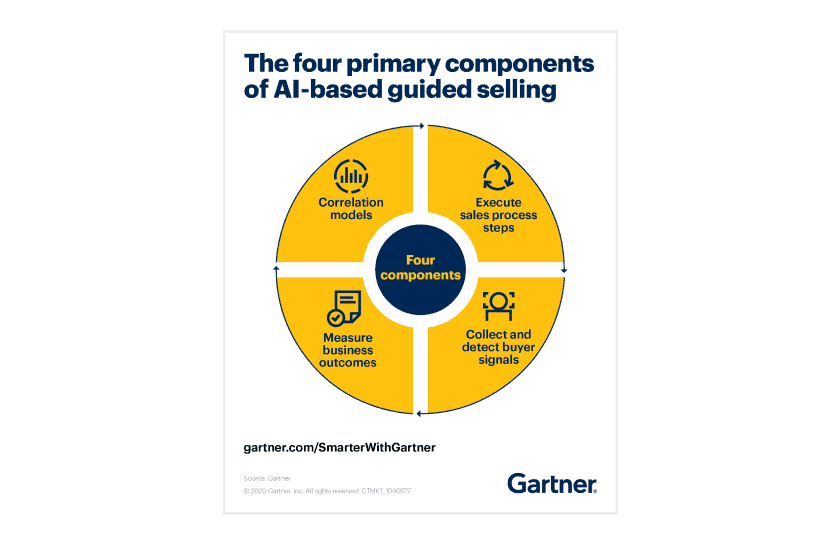
In a 2020 report, Gartner emphasizes that organizations must focus on building adaptive systems enabled by AI and “hyper-automation” to engage buyers in today’s digital-first selling environment.
Researchers say an increased interdependence between people, technology, and processes is making traditional sales models less reliable. And in response, the firm says sales processes, apps, analytics, and data are merging under one general concept: AI for sales.
You’ll want to make sure you select technology that allows you to do the following:
- Create predictive models
- Automate steps of the sales process
- Track & measure business outcomes
- Capture & detect buyer signals
As an example, Revenue Grid users can increase pipeline velocity with AI-enabled Deal Guidance. Sales leaders can define Revenue Signals in advance based on known best practices and historical data. From there, the AI uses those signals and serves proactive alerts telling reps what to do next–and how they should take action.
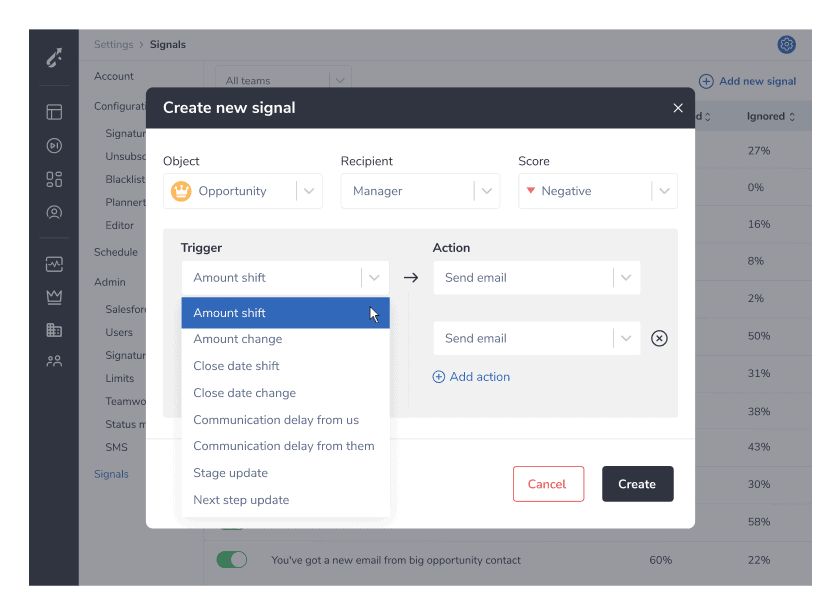
AI Signals can also surface at-risk deals and stalled opportunities. Sales leaders can set up automated alerts for changes in deal status, pipeline, or customer communications—and can course-correct before it’s too late—with hands-on coaching, improved sales collateral, or different outreach tactics.
Present sales analytics data with end-users in mind
As mentioned, sales analytics enable accurate, real-time decision-making. But that can only happen when information is presented the right way—in context with end-user goals.
Avoid forcing employees to rely on ad-hoc reporting tools. It’s too open-ended for most people—particularly if they don’t have experience working with data.
So, for a high-level role like VP of Sales, you’ll want to address barriers that could lead to poor decisions.
It’s hard to understand a situation when all you have is a spreadsheet—no matter how good the data is. So, you might look for visual reporting tools and dashboards that communicate ideas visually, as well as automated alerts that let them know when they need to take action.
For sales managers and coaches, the goal shifts toward tracking the impact of specific activities and using that information to get better results from reps.
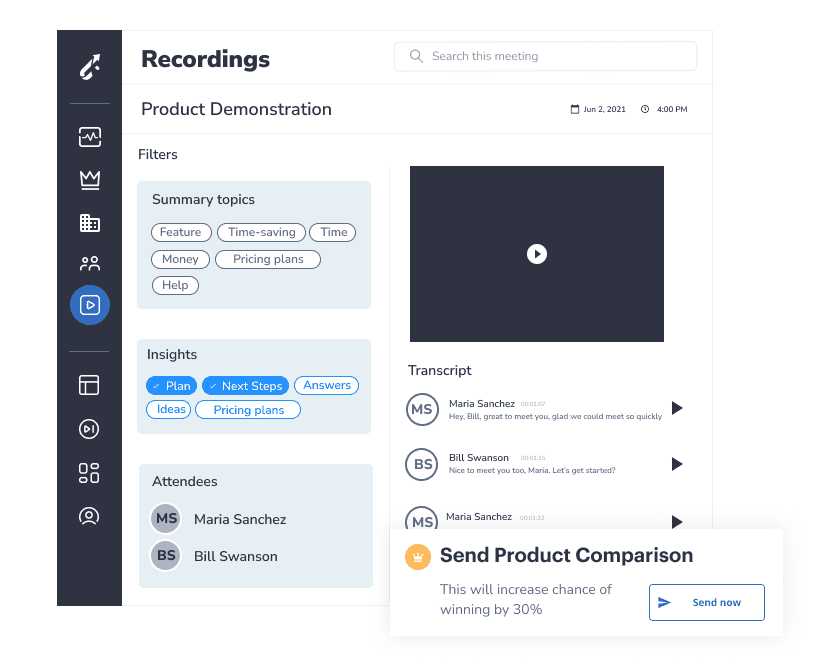
For example, conversational intelligence can be used to identify techniques top sellers use “in the wild” to push deals through the pipeline. Sales coaches might use call recordings or other communications records to bring struggling reps up to speed—which is much more effective than relying on lectures and role-play games alone.
Final thoughts
Sales analytics strategies and metrics are always evolving—changing alongside customers, technologies, and business goals.
That said, the aim is always the same. Sales analytics is ultimately about understanding all factors that impact sales performance–from emerging trends and audience behaviors, to the tactics most effective for moving deals through the pipeline.