
Key Takeaway
- Pipeline visibility is the real-time ability to see every deal’s status, health, and trajectory, including who is involved, what has happened, and where it is headed.
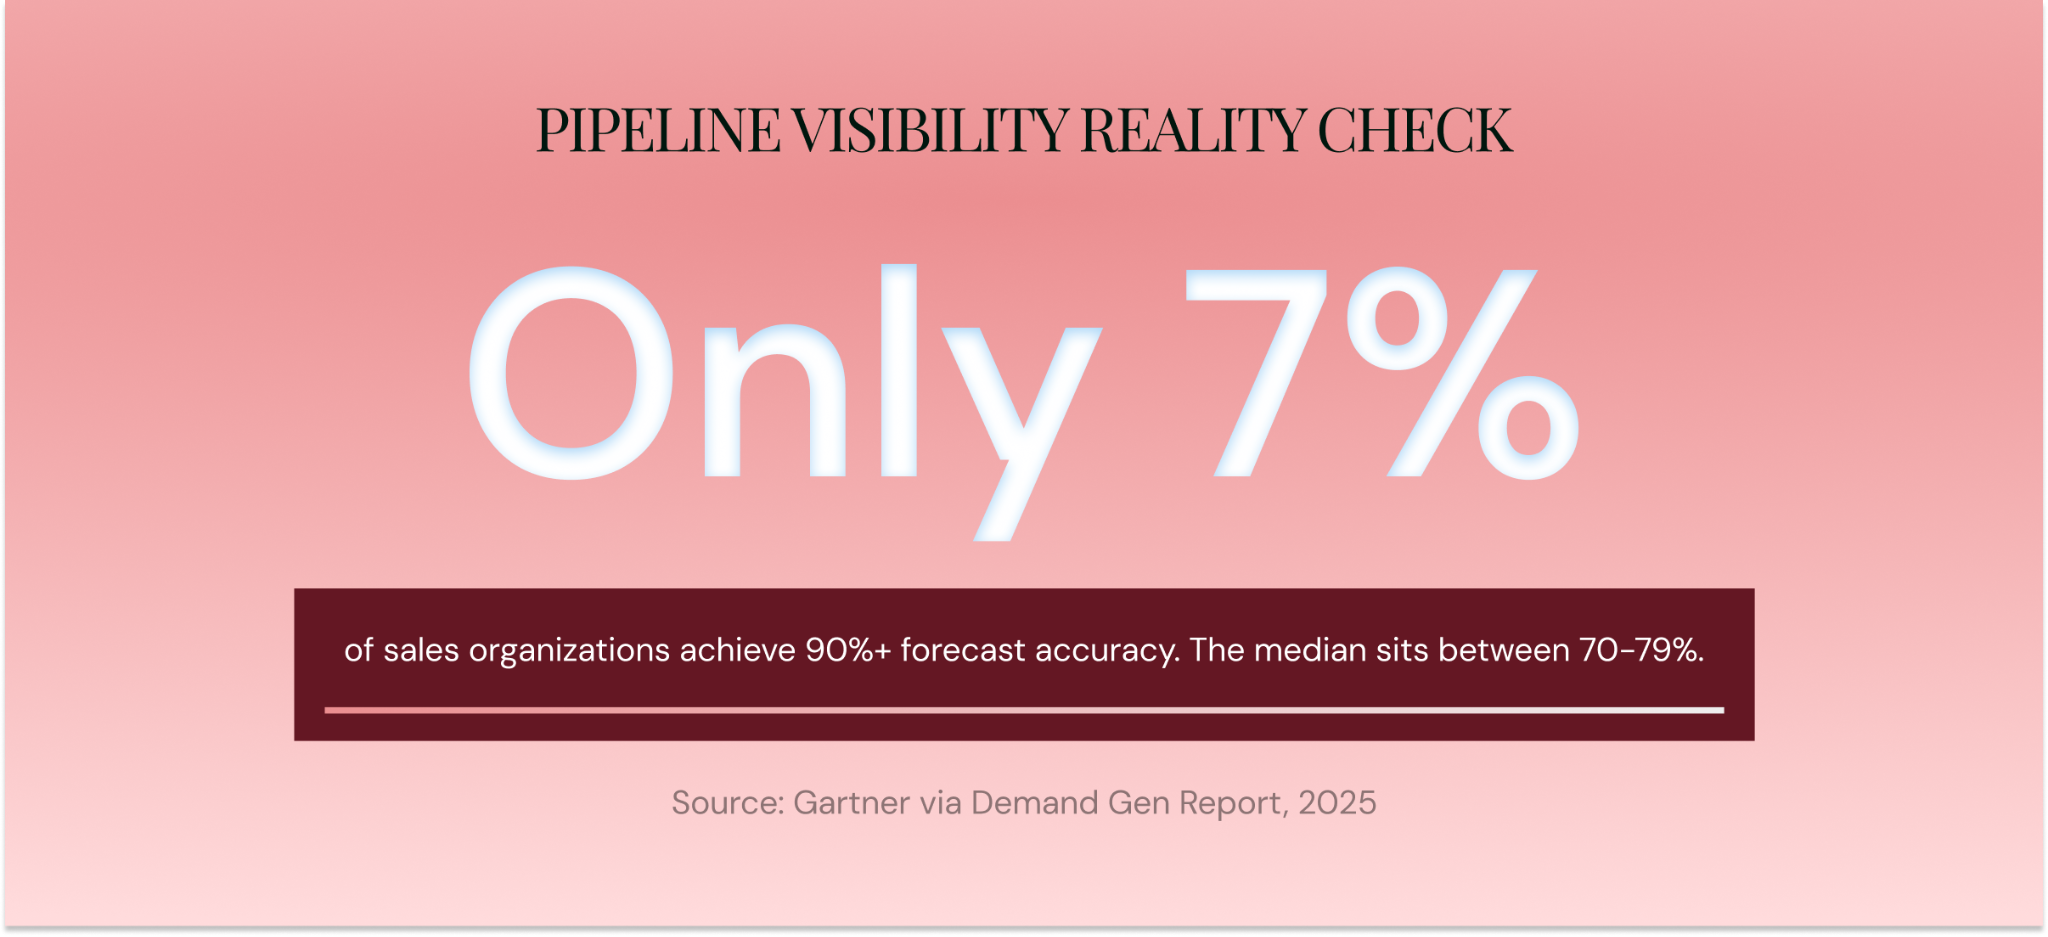
- Only 7% of sales organizations hit 90%+ forecast accuracy. The root cause is invisible data, buried in inboxes and calendars instead of the CRM.
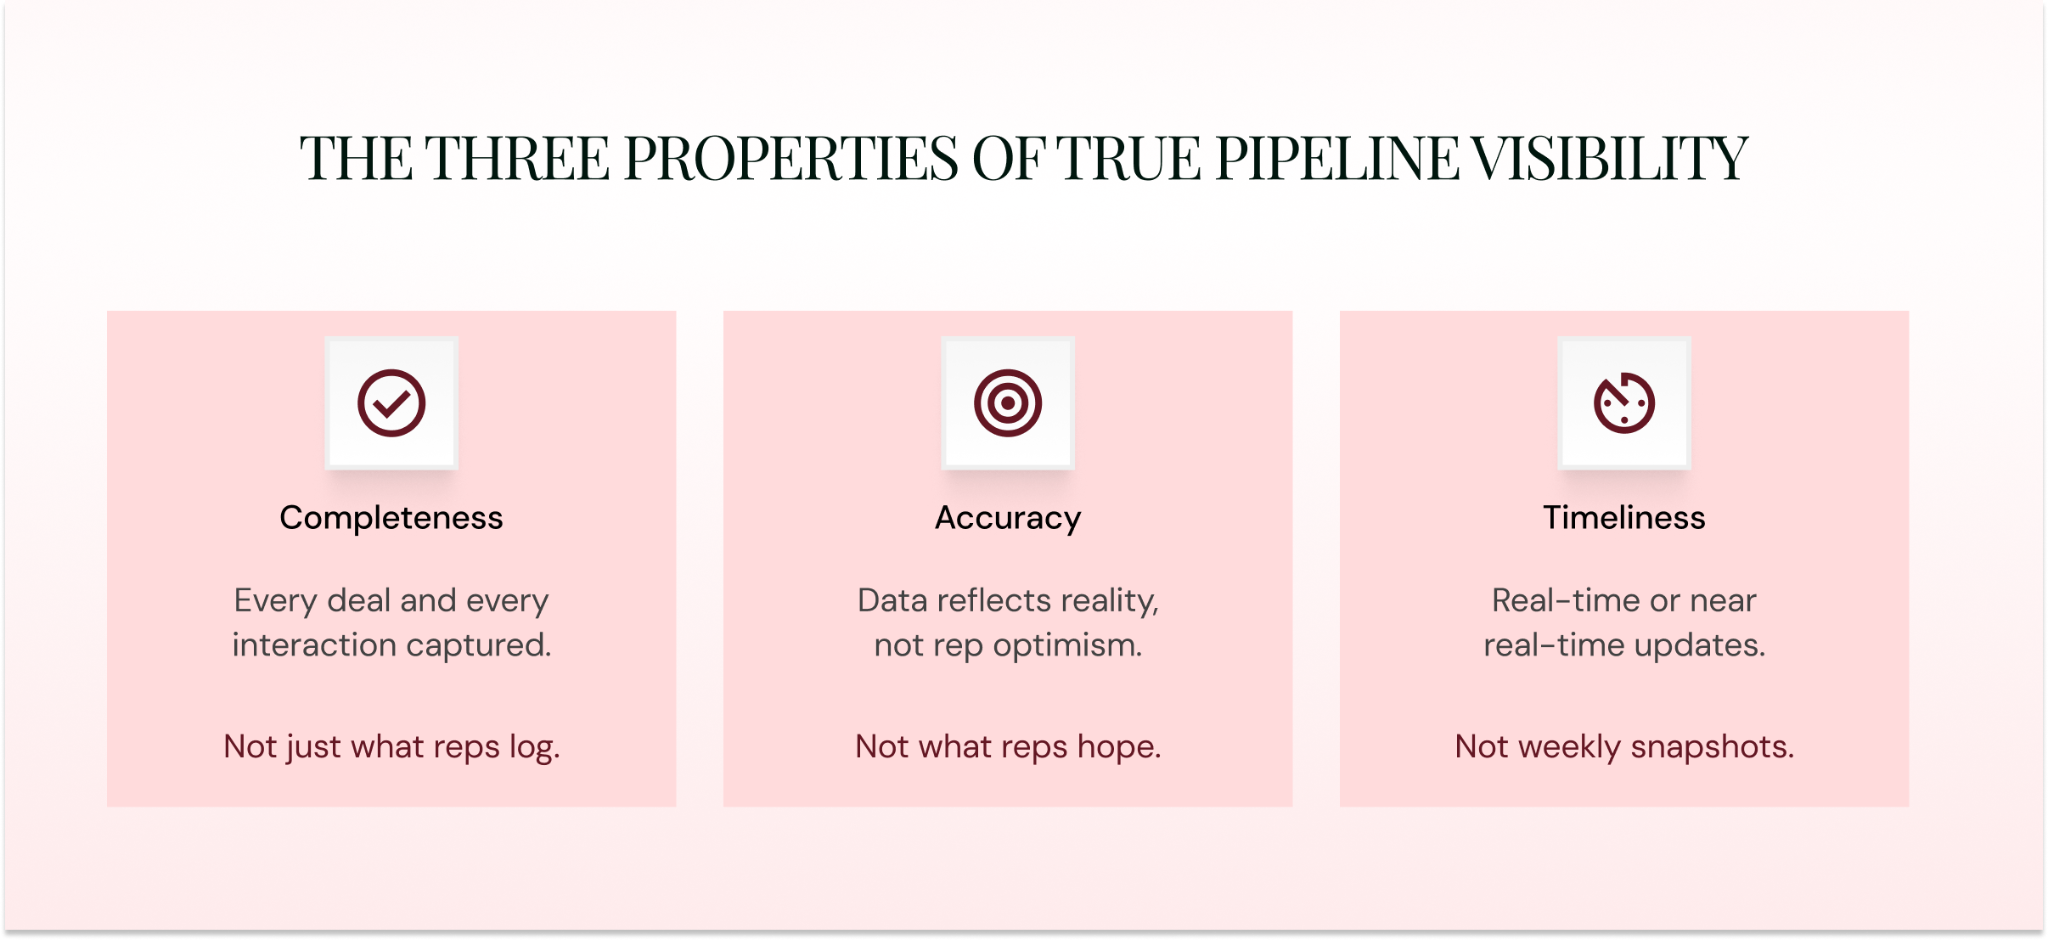
- True visibility requires three things working together: completeness (every interaction captured), accuracy (data reflects reality), and timeliness (real-time updates instead of weekly snapshots).
- Six metrics tell you whether visibility is real or imagined: pipeline coverage ratio, velocity, stage conversion rates, deal aging, engagement scoring, and forecast accuracy.
- Visibility is a data-capture problem first and a dashboard problem second. Fix capture first, and everything else follows.
- A seven-step framework (audit → standardize → automate → dashboard → review → AI → iterate) gives you the roadmap.
- Different roles need different views. One dashboard for everyone means zero people use it.
A CRO walks into a board meeting, presents a $14M pipeline number with full confidence, and misses the quarter by 30%.
The sales team was performing well, with reps running active deals, buyers responding to outreach, and calls happening across the pipeline. All of that activity stayed invisible inside the CRM. Emails went unlogged, meetings were unrecorded, and deal stages reflected when the rep last touched the record rather than where the deal actually stood.
Gartner research puts hard numbers behind this: only 7% of sales organizations achieve 90% or higher forecast accuracy, with the median hovering between 70–79%. That gap shows into missed hiring plans, wasted marketing budgets, and board meetings that end with uncomfortable silence.
This guide breaks down what pipeline visibility actually means, where it fails, and how to build it from the data layer up. It includes formulas, benchmarks, and a step-by-step framework you can start executing this quarter.
What Is Pipeline Visibility (and How Does It Differ from Reporting)?
Pipeline visibility is the ability to see, in real time, the status, health, and trajectory of every deal in a sales pipeline. That includes who is involved on both sides, what interactions have happened, where deals stand relative to expected milestones, and how likely they are to close.
It differs from having a CRM, running a pipeline report on Friday, or glancing at a dashboard before the forecast call. Those are tools. Visibility is a capability. The distinction matters because most organizations believe they already have visibility when they actually have a partial, outdated snapshot dressed up in nice charts.
True pipeline visibility has three properties. Completeness means every deal and every interaction is captured, including the ones reps forget to log. Accuracy means data reflects what is actually happening rather than what a rep hopes is happening. Timeliness means real-time or near-real-time updates rather than a snapshot that is already stale by Monday afternoon. Miss any one of these three, and the pipeline view becomes decoration.
How Pipeline Visibility Differs from Pipeline Management and Reporting
Management is the act of moving deals forward: coaching reps, advancing stages, removing blockers. Visibility is the ability to see what is actually happening across those deals. Reporting is a backward-looking analysis of what already happened. The relationship is sequential: you can only manage what you can see, and reports only tell you where you have already been.
Managing a pipeline without visibility is like coaching a basketball game from a soundproof room. You can draw up plays all day, with zero idea of what is happening on the court.
A pipeline report might tell you 40% of deals closed last quarter, which is useful for a retrospective but entirely useless for knowing which deals are at risk right now. Organizations that confuse reports with visibility are the ones whose forecasts miss quarter after quarter.
| Dimension | Pipeline Visibility | Pipeline Management | Pipeline Reporting |
| Definition | Real-time view of every deal’s status, health, and trajectory | The act of advancing deals through stages | Historical analysis of pipeline outcomes |
| Time orientation | Present | Present + future | Past |
| Purpose | See what is happening | Act on what is happening | Understand what happened |
| Key question | What is the real state of our pipeline right now? | What should we do next on this deal? | How did we perform last period? |
| Output | Live dashboards, signals, alerts | Coaching actions, deal strategies | Static reports, charts, summaries |
Six Ways Pipeline Visibility Directly Impacts Revenue
Pipeline visibility directly shapes the outcomes revenue leaders are measured on every quarter. Here is how it translates into dollars and decisions.
- Forecast accuracy goes up. Without visibility, forecasts are educated guesses. With it, leaders project revenue based on real-time deal data, engagement signals, and historical stage progression. A 20% forecast miss cascades into every part of the business: hiring plans, marketing budgets, investor confidence, and operational planning. Visibility shrinks that miss.
- At-risk deals get caught early. The warning signs are specific: declining email reply rates, canceled meetings, stalled stage progression (a deal sitting in “Proposal” for three times the average duration), and a single-threaded deal in a buying process that involves 5–16 stakeholders. Visibility surfaces these signals in week two instead of week eight, when the deal is already dead.
- Resources land where they matter. When leaders see pipeline concentration by stage, segment, territory, or rep, they can shift marketing spend to segments with thin early-stage pipeline, deploy executive sponsors on high-value deals showing engagement drops, or redistribute territories before one rep drowns and another starves.
- Coaching gets specific. “You need more pipeline” is vague advice that changes zero behavior. “Deal X has had zero buyer contact in 14 days, so let’s map out a re-engagement sequence” is actionable guidance that changes outcomes. Data-grounded coaching changes behavior because it gives managers and reps a shared, specific starting point.
- Cross-functional alignment happens by default. When sales, marketing, CS, and finance all see the same pipeline truth, the arguments disappear. A single source of pipeline truth means everyone debates from the same data instead of from separate spreadsheets.
- Board confidence increases. For CROs presenting to a board, the difference between “we think the number is $14M” and “here is the deal data, engagement trends, and risk factors behind that $14M” is the difference between trust and scrutiny. This matters especially for organizations with long sales cycles and quarter-to-quarter variability.
The Foundation Everyone Skips: Data Quality
Here is the truth on pipeline visibility that many skip entirely.
Pipeline visibility is a data problem first and a dashboard problem second. The most sophisticated analytics tool on the market produces garbage insights when the underlying data is incomplete, inaccurate, or stale. Every pipeline visibility failure traces back to the same root cause: the data under the dashboard was captured partially, or was captured late, or was captured by the wrong person making their best guess.
The chain is simple: data capture → data quality → pipeline visibility → accurate forecasting → revenue growth. Break it at any point, and everything downstream collapses.
Why CRM Data Is (Structurally) Incomplete
This is a system design issue, plain and simple. CRM data depends on manual entry by reps who are incentivized to sell, and CRM updates feel like administrative overhead that gets skipped when the quarter gets tight. The result: emails go unlogged, meetings stay unrecorded, call notes are incomplete, and deal stages reflect when the rep last updated the record rather than where the deal actually stands.
The numbers confirm this. Salesforce’s own State of Sales research found that only 35% of sales professionals fully trust their organization’s data. Meanwhile, reps spend roughly 70% of their time on tasks that have nothing to do with selling, including manual data entry.
Asking humans to manually log every interaction across email, phone, Slack, Teams, LinkedIn, and in-person meetings is an unreasonable expectation. The system was designed in a way that guarantees incomplete data.
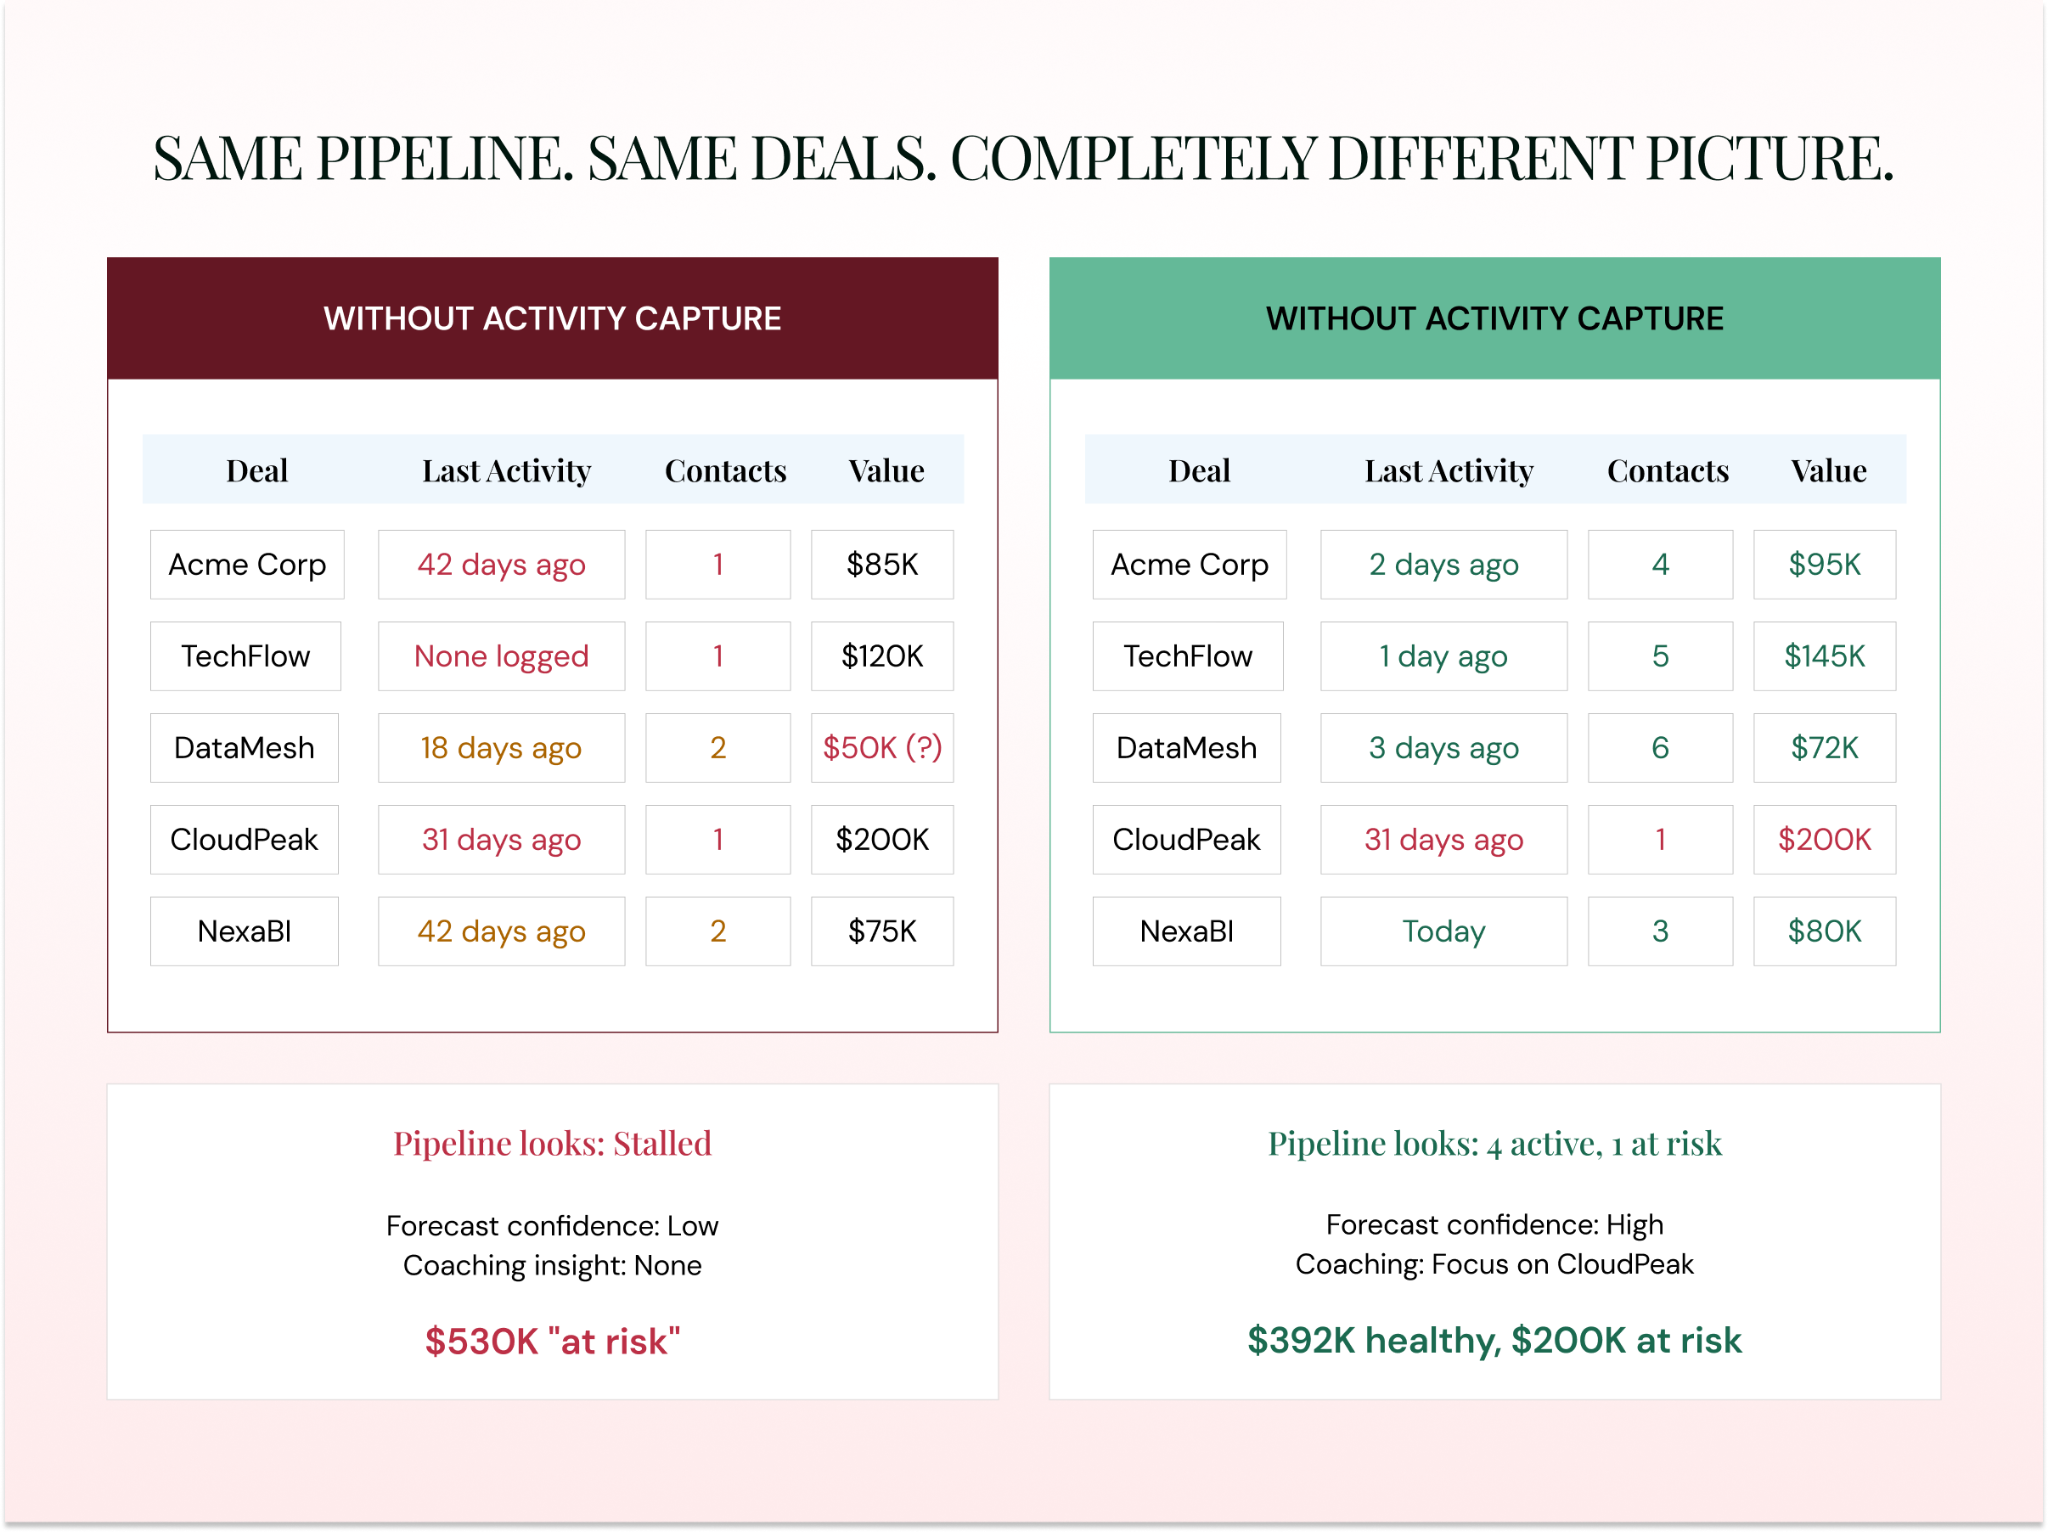
Same pipeline. Same deals. Completely different picture.
What Missing Data Actually Costs
Validity’s 2024 State of CRM Data Management report puts a number on it: 44% of organizations lose more than 10% of their annual revenue to low-quality CRM data. Nearly a quarter of CRM admins say less than half of their data is accurate.
The downstream consequences compound. A deal appears stalled when it is actually active because the rep had three calls this week and logged zero in CRM. The stakeholder map is incomplete because the economic buyer has been engaged for a month yet is still missing from the contact list. The forecast is built on a deal value from two months ago that no longer reflects the current proposal. Each missing data point distorts the pipeline view further.
Automated Activity Capture: Fixing the Root Cause
Automated activity capture solves the data quality problem at its source by logging emails, meetings, calls, and other interactions into the correct CRM records with zero manual effort from reps.
The difference between basic email sync (logging subject lines and timestamps) and intelligent capture is significant. Intelligent capture maps multi-threaded conversations to the correct opportunities, identifies all participants, and extracts context: what was discussed, what was decided, and how it maps to deal progression. Revenue Grid’s Activity Capture 360 does this automatically across all communication channels, even when deals involve multiple reps or cross-threaded email chains. At Vapotherm, this captured 110,000 emails and 27,000 calendar events in year one, saving 761 person-days of manual work.
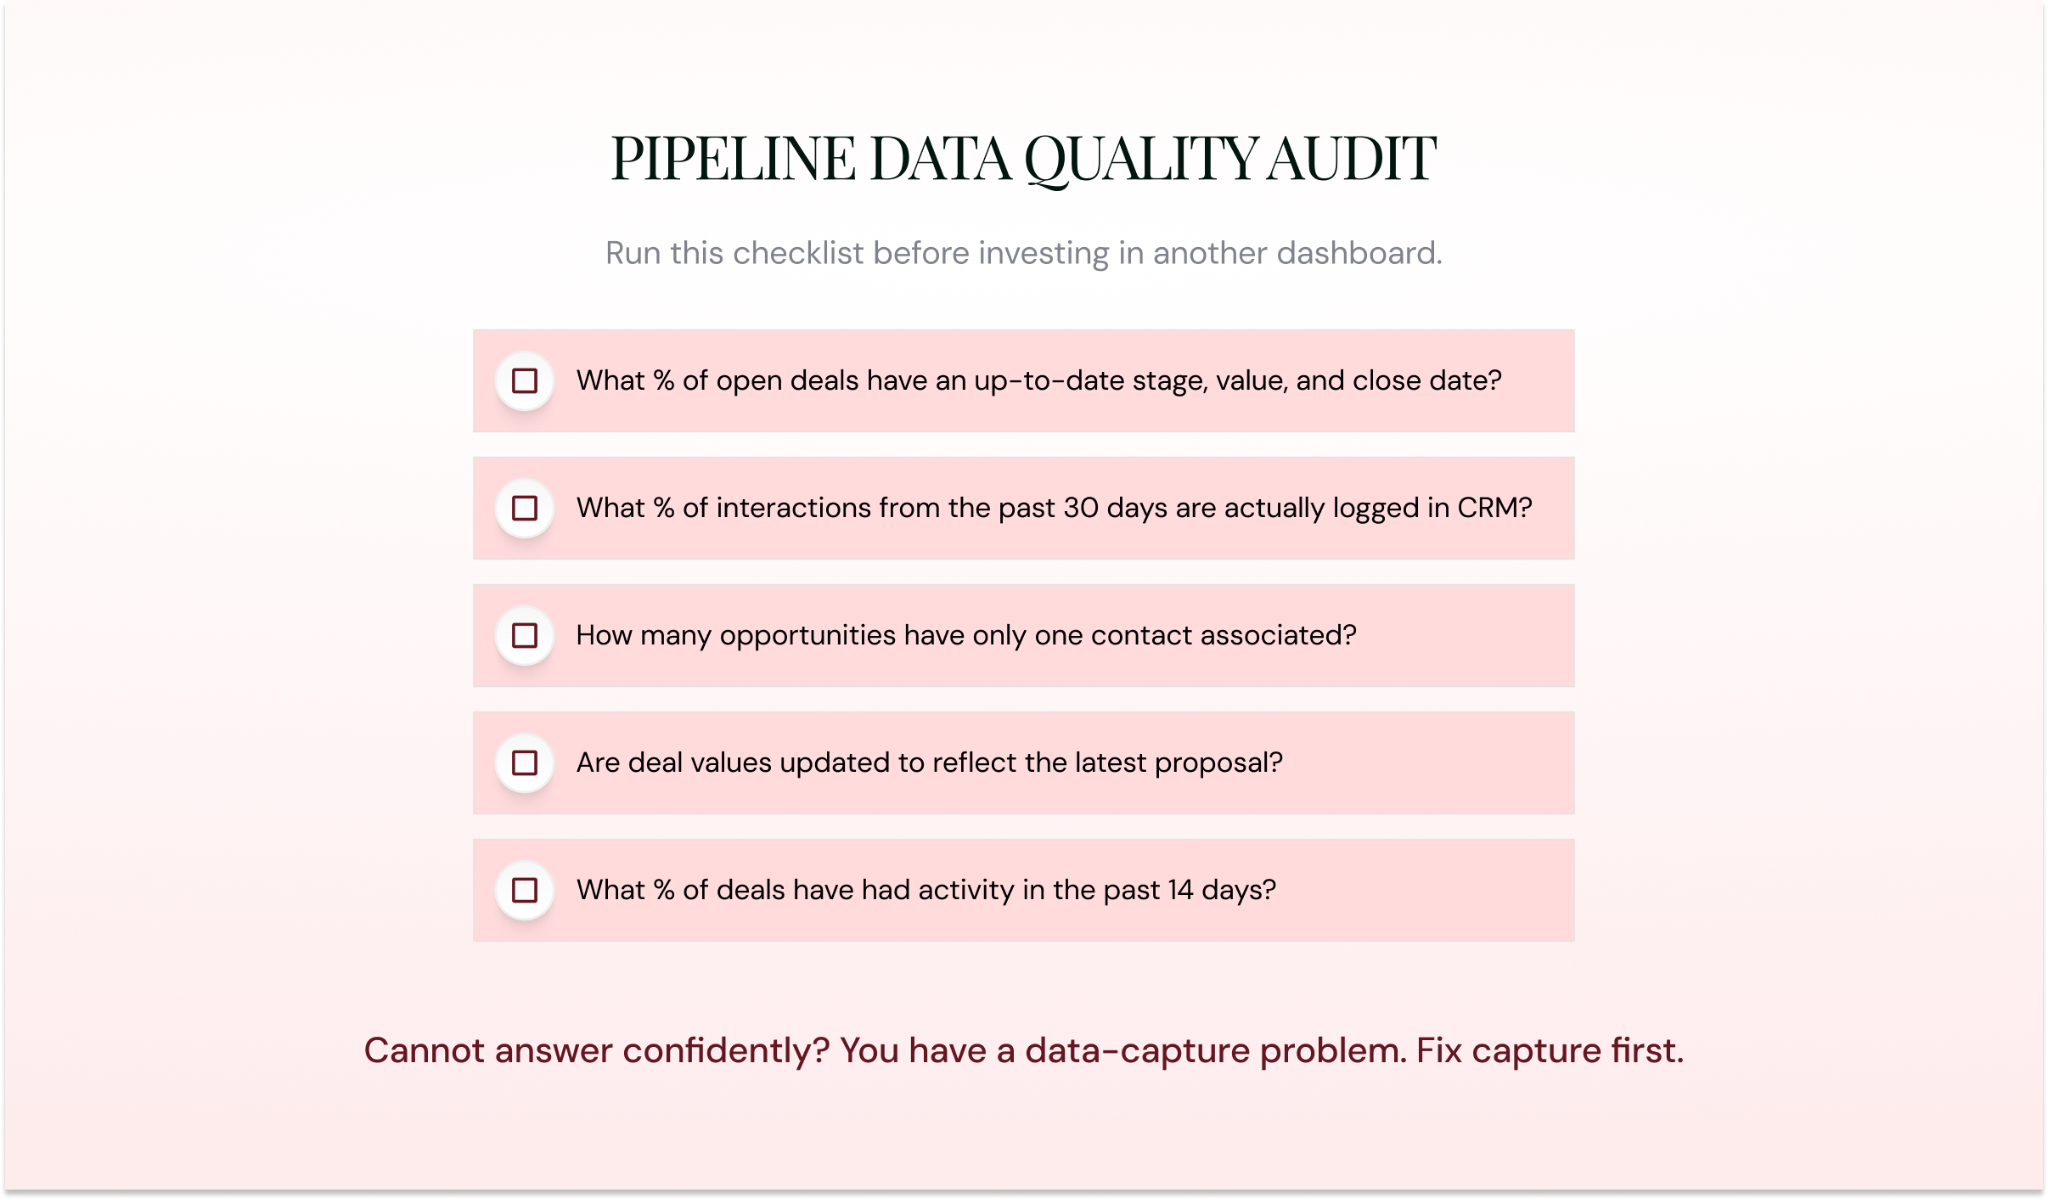
A Data Quality Checklist You Can Run This Week
Before investing in another dashboard, answer these six questions about your current pipeline:
The Six Metrics That Prove You Have Real Pipeline Visibility
When you can calculate these six numbers from your current data, you have pipeline visibility. When you struggle to produce them, you have pipeline decoration.
| Metric | Formula | Benchmark | Why It Matters |
| Pipeline Coverage Ratio | Total pipeline value ÷ revenue target | 3–4x (segment-specific) | Below 3x = insufficient pipeline. Above 5x = likely bloat. |
| Pipeline Velocity | (Opportunities × Avg Deal Value × Win Rate) ÷ Avg Cycle Length (days) | Varies by ACV band | Revenue throughput per day. Identifies which lever to pull. |
| Stage Conversion Rates | % of deals advancing from each stage to the next | Identify drop-off points | Pinpoints exactly where the pipeline leaks. |
| Deal Aging | Days in current stage vs. historical average | 1.5x avg = yellow; 2x = red | Catches stalled deals regardless of what the rep says. |
| Engagement Scoring | Composite: email response rates, meeting frequency, stakeholder count, response latency | Trending up = healthy; declining = risk | A leading indicator. Stage updates are lagging. |
| Forecast Accuracy | 1 − (|Forecasted − Actual| ÷ Actual) | 85%+ within rolling 4 quarters | The ultimate proof metric. |
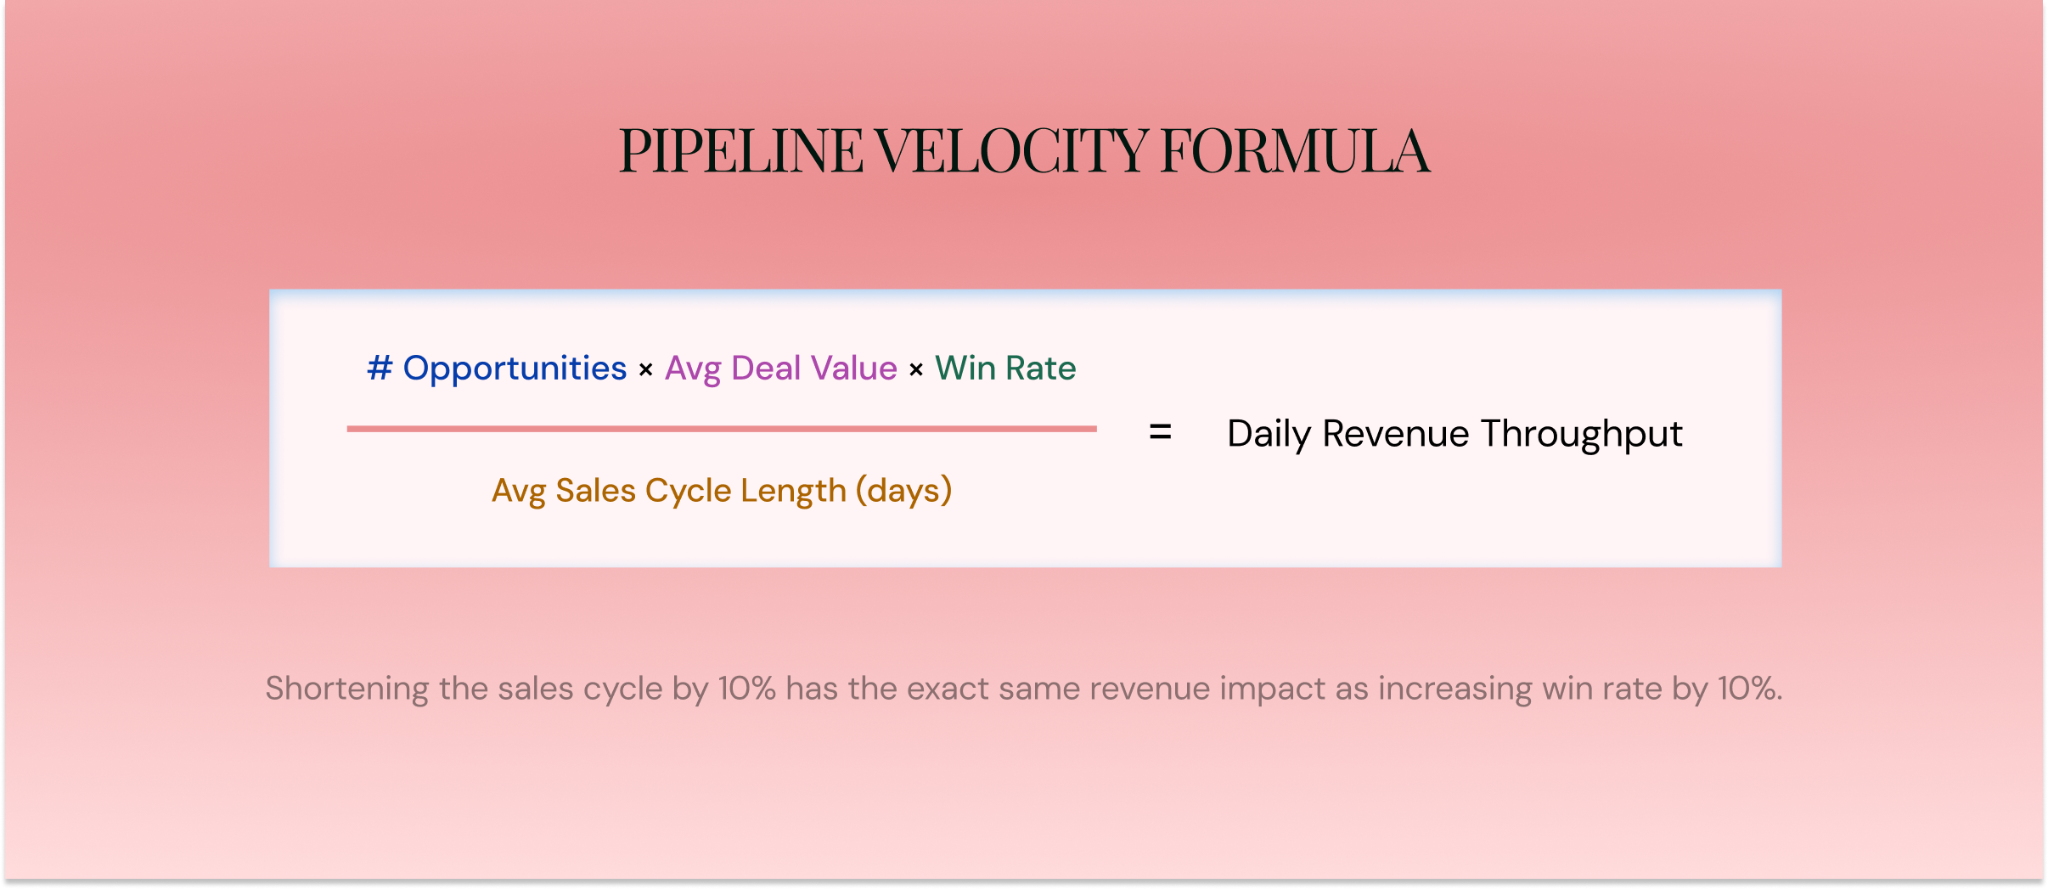
One metric deserves extra attention: pipeline velocity. Shortening the sales cycle by 10% has the exact same revenue impact as increasing your win rate by 10%. Most teams obsess over win rate and ignore cycle length entirely, even though velocity makes all four levers visible at once: the number of deals, deal size, win rate, and time. That diagnostic power is what sets it apart from any single metric.
Six Pipeline Visibility Failures (and the Specific Fix for Each)
Every organization hits the same walls. The difference between teams that achieve visibility and those that keep buying dashboards is whether they treat these patterns as solvable or permanent.
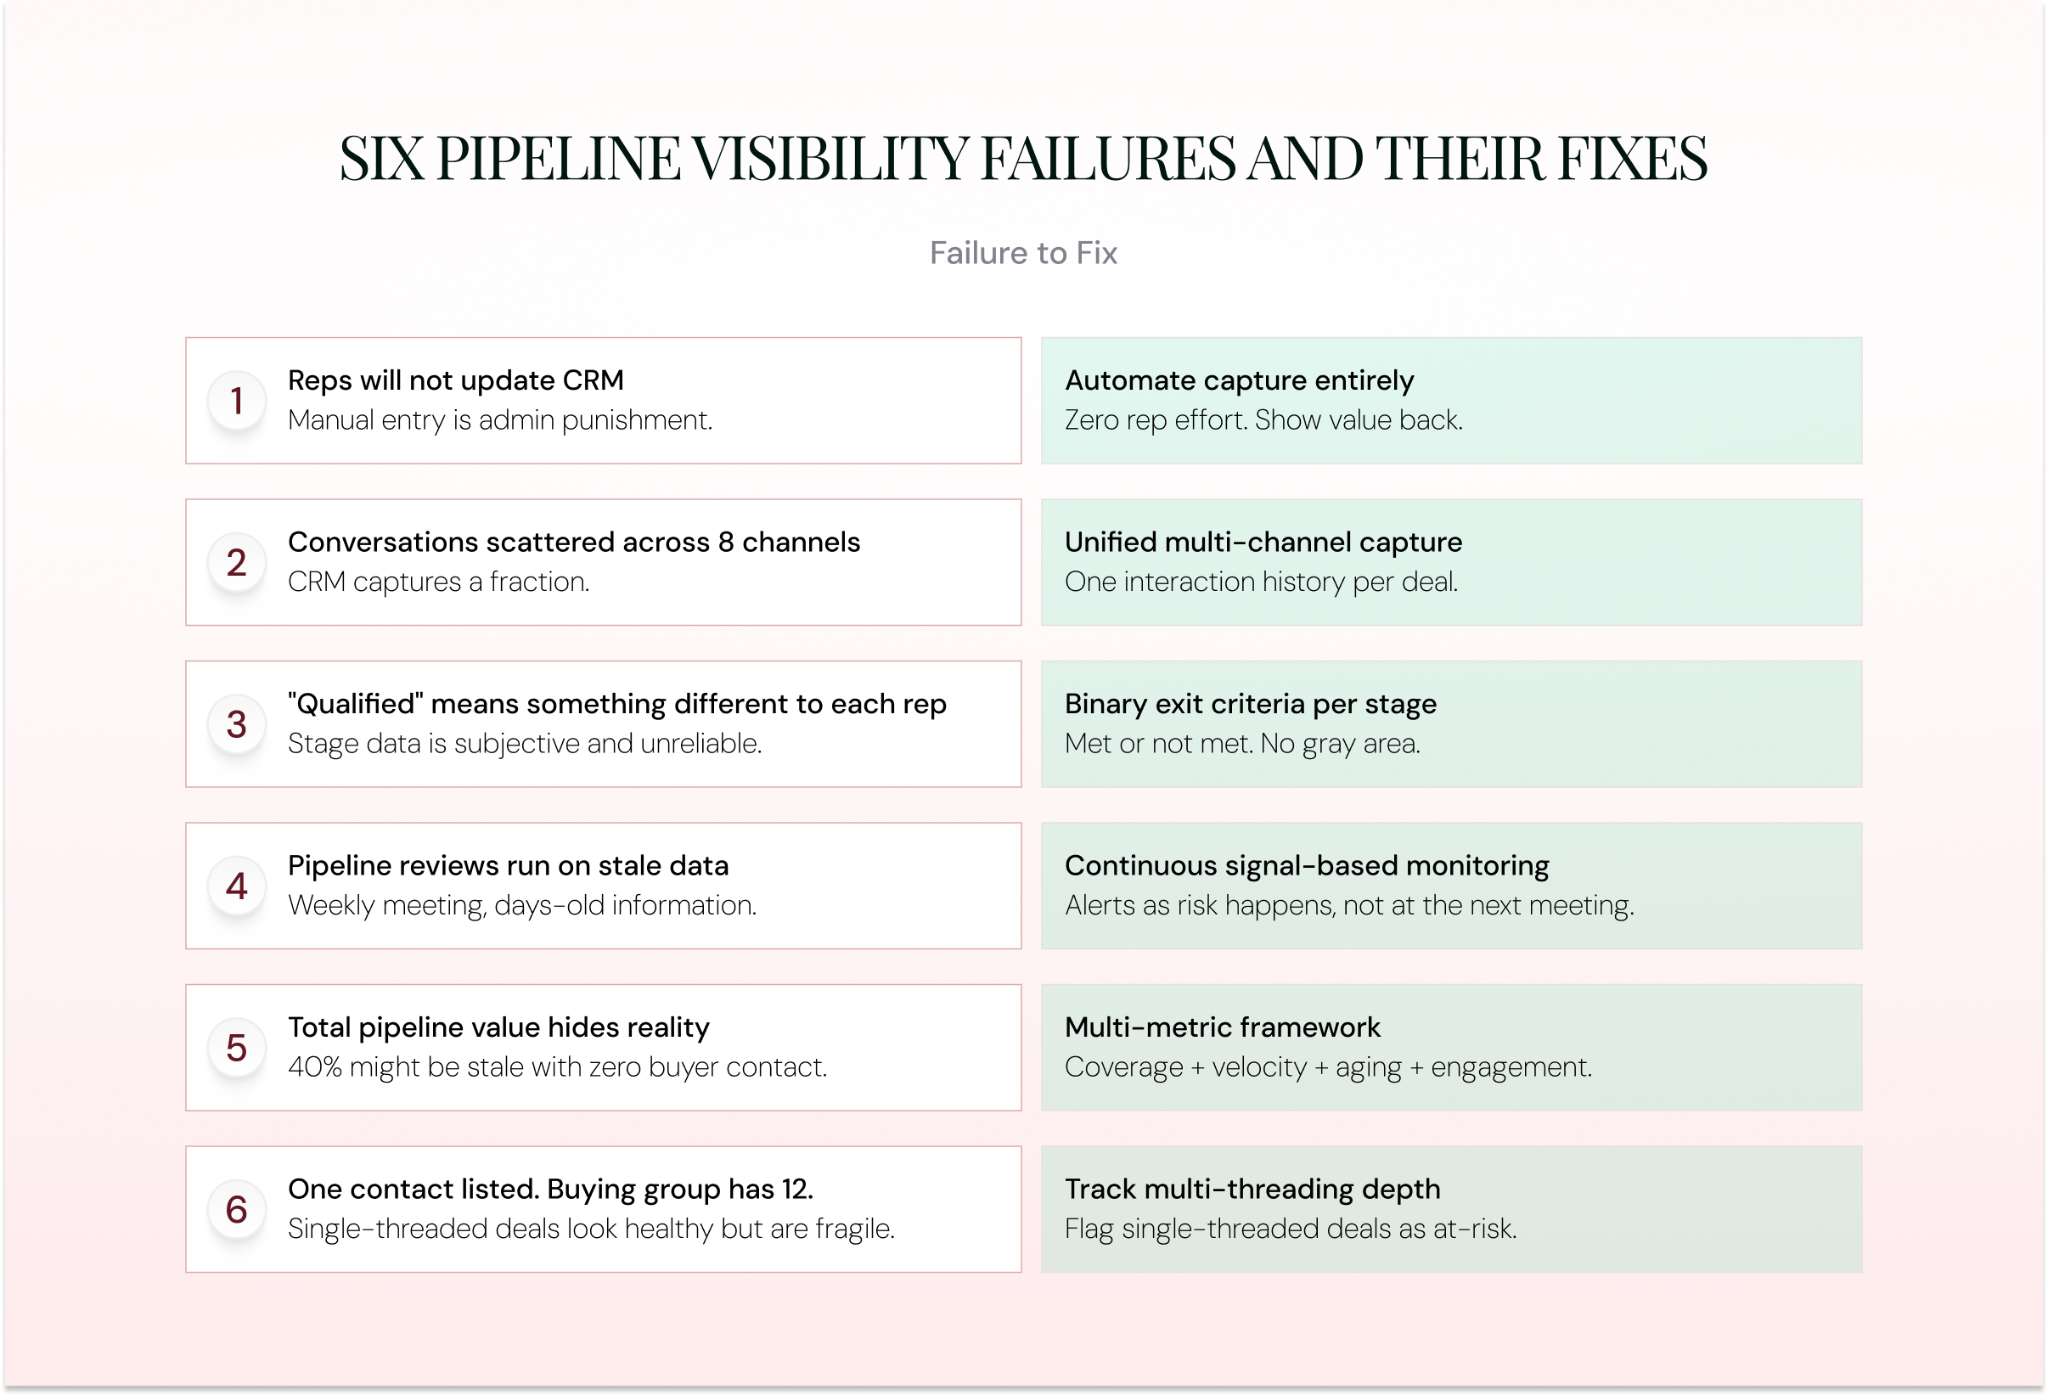
- Reps skip CRM updates. CRM feels like administrative punishment rather than a selling tool. Reps skip updates, managers nag, adoption briefly spikes, then drops again. The fix: remove the burden entirely through automated activity capture, then show reps the value flowing back to them: better coaching, deal support, and smarter lead routing. Make the CRM a tool that helps them close deals.
- Buyer conversations are scattered across eight channels. Emails, phone calls, Zoom, Teams, Slack, LinkedIn messages, and in-person meetings all contain deal-relevant information, yet CRM captures only a fraction, typically just emails and only when reps remember to log them. The fix: integrate all channels into a unified capture system that syncs interactions to the correct CRM records automatically.
- “Qualified” means something different to every rep. One rep moves a deal to “Qualified” after a single discovery call, while another waits until budget is confirmed. This subjectivity makes stage conversion metrics meaningless and pipeline reports unreliable. The fix: define objective, binary exit criteria for each stage. Example: “Qualified = budget range confirmed + decision-maker identified + timeline established + pain point articulated.” Met or still open. Zero gray area.
- Pipeline reviews run on stale data. A weekly meeting reviews a pipeline that was last updated days ago, and deals deteriorate between reviews as champions go dark, competitors enter, or timelines shift. The fix: shift to continuous, signal-based monitoring. Revenue Grid’s Revenue Signals flags engagement drops, stage stalls, and missing stakeholders as they happen.
- Total pipeline value creates false confidence. A $10M pipeline looks healthy until you realize 40% of it is stale deals with zero buyer contact in 60+ days. The fix: track coverage, velocity, conversion, aging, and engagement together. Evaluate pipeline health through the full multi-metric framework.
- Deals show one contact, but the buying group has twelve. Gartner’s 2025 Sales Survey found that B2B purchases involve 5–16 stakeholders across up to four functions. A deal can look healthy based on one enthusiastic contact while the actual decision-maker remains entirely disengaged. The fix: track multi-threading depth (unique stakeholders engaged per deal) and flag single-threaded deals as at-risk.
A Seven-Step Framework for Building Pipeline Visibility
Here is a step-by-step methodology you can start executing this quarter.
Step 1: Audit your current pipeline data. Before building anything, measure what you have. What percentage of open deals have an up-to-date stage, value, close date, and at least one contact? What percentage of the past 30 days’ interactions are logged? How many deals have had any activity in the past 14 days? The output is a baseline data quality score, the honest starting point.
Step 2: Standardize your sales process and stage definitions. Document 5–7 pipeline stages with binary exit criteria. Train the team. Build the stages into CRM with required fields at each transition. Every rep and manager operates from the same playbook, with zero exceptions.
Step 3: Implement automated activity capture. This is the single highest-leverage step. Deploy technology that captures emails, meetings, calls, and other interactions automatically and maps them to the correct CRM records. Revenue Action Platforms like Revenue Grid do this natively within CRM and email systems, with zero workflow changes required from reps. At Rand Simulation, this approach produced a 25% increase in new-logo pipeline within 12 months.
Step 4: Build role-specific dashboards. Reps see their own deals and next actions. Managers see team pipeline health and coaching opportunities. VPs see territory trends. CROs see the business-level forecast and risk concentration. One dashboard for all roles is a common mistake because different decisions need different data.
Step 5: Establish tiered pipeline review cadences. Daily: automated signal-based alerts for reps covering deal risk flags, engagement drops, and overdue tasks. Weekly: team pipeline reviews for managers focused on at-risk deals, coaching, and forecast updates. Monthly/Quarterly: strategic reviews for leadership covering pipeline coverage vs. target, forecast accuracy trends, and resource allocation.
Step 6: Layer in AI-driven insights and signals. Move beyond static dashboards to systems that surface deal risk signals, recommend next actions, and flag anomalies proactively. This is the evolution from visibility (seeing) to actionability (doing). Revenue Grid’s Deal Guidance surfaces signals like: “This deal’s engagement score dropped 40% this week” and “Similar deals without executive engagement close at 12% vs. 45% with executive involvement.” Specifics that drive action.
Step 7: Measure, iterate, and scale. Compare your baseline from Step 1 to current performance quarterly. Identify what improved and where gaps persist. Scale what works from one team or region across the organization. The goal is steady progression, from ad-hoc to standardized to automated to AI-driven to predictive. Progress one stage at a time.
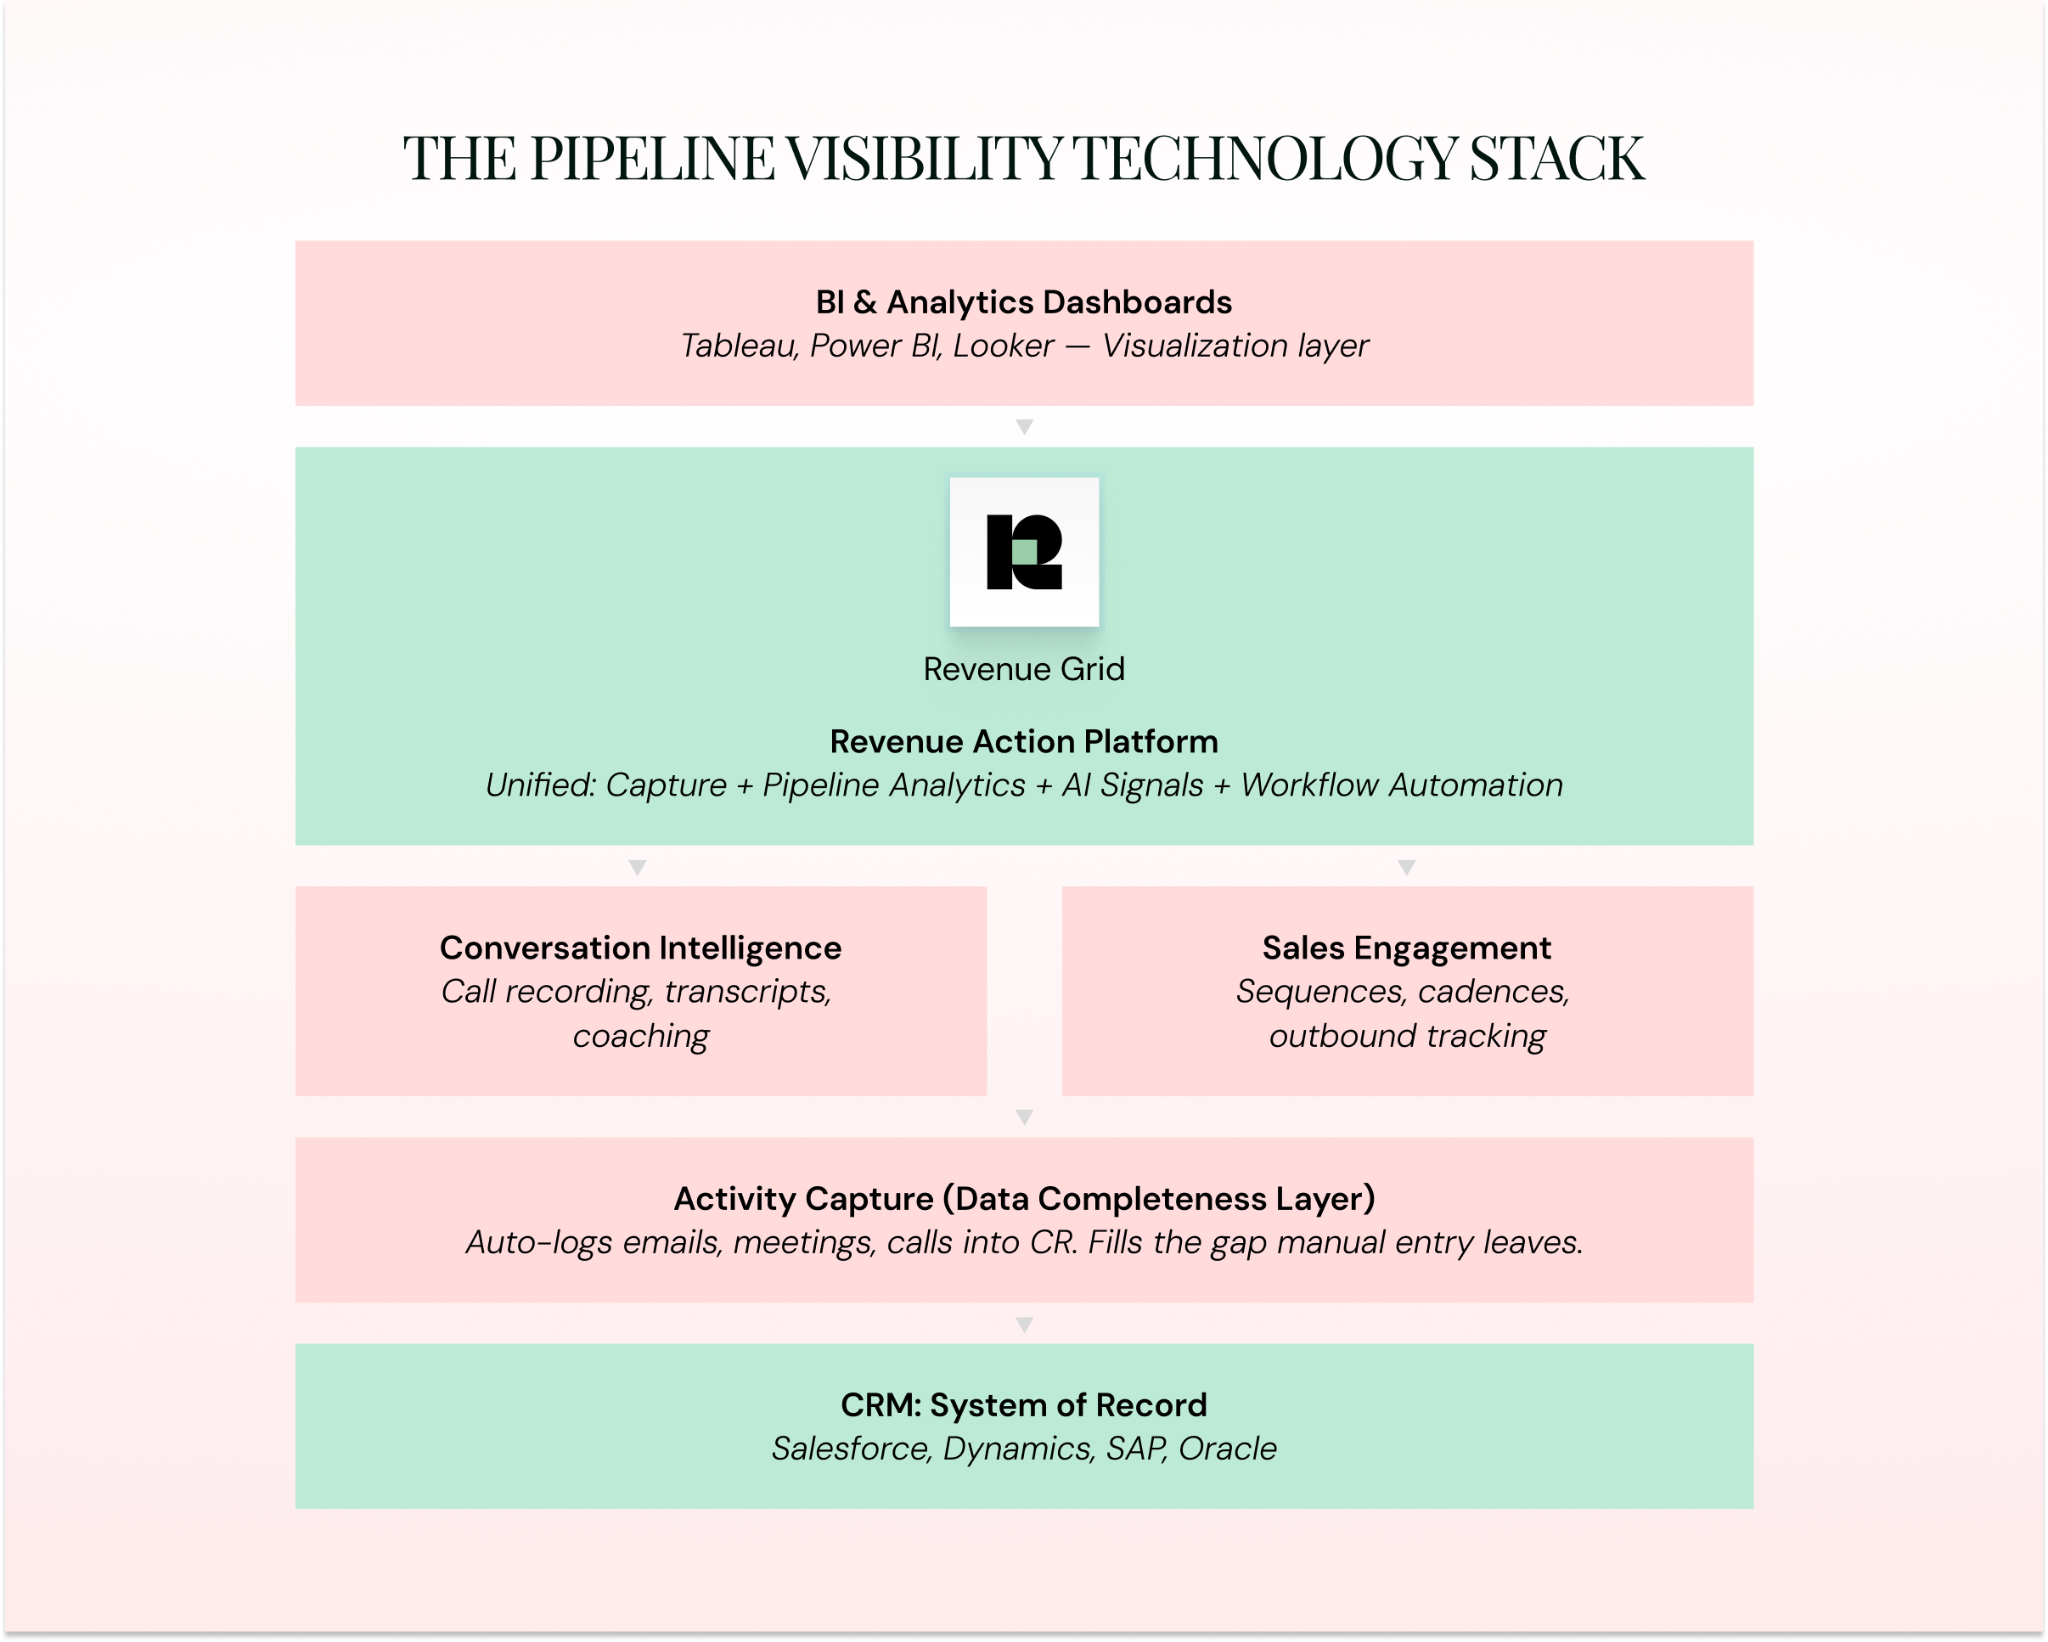
The Technology Stack Behind Pipeline Visibility
The most effective approach layers multiple categories, ideally in a unified platform instead of stitching together six point solutions and hoping they communicate with each other.
| Tool Category | Visibility Contribution | Limitation Alone |
| CRM (Salesforce, Dynamics, SAP, Oracle) | Baseline pipeline views and reports | Only as good as the data entered into it |
| Activity Capture | Data completeness; fills the gap reps leave behind | Capture without analytics is raw data, still requiring interpretation |
| Revenue Action Platforms | End-to-end: capture + analytics + AI + workflow | Requires CRM foundation and process standardization |
| Conversation Intelligence | Visibility into what is said in calls | Only captures recorded, scheduled conversations |
| Sales Engagement | Prospecting and early-stage visibility | Focused on seller activity rather than buyer signals |
| BI Dashboards (Tableau, Power BI) | Custom views for stakeholders | A visualization layer that can only display what was captured elsewhere |
One category deserves special attention. Gartner published its first Magic Quadrant for Revenue Action Orchestration in December 2025, defining platforms that combine data capture, pipeline analytics, AI-driven insights, and workflow automation into a single system. Revenue Grid fits this category, unifying activity capture, 360-degree pipeline visibility, and AI-driven signals in a platform native to Salesforce, SAP, Oracle, and Microsoft Dynamics. This eliminates the duct-taped stack of separate capture, analytics, and engagement tools that most mid-market teams are running (and paying $400–600K/year for across a 100-rep organization).
What Each Role Needs to See
A CRO reviewing pipeline coverage vs. target and a rep deciding what to do next on a stalled deal need fundamentally different views. Building one dashboard and expecting both personas to use it is how you end up with a dashboard that sits idle.
| Role | Key Metrics | Dashboard Focus | Review Cadence | Key Decision |
| Sales Reps | Deal status, next steps, engagement trends, buyer contacts | My deals, my actions | Real-time + daily | What do I do next on every deal? |
| Sales Managers | Team quota attainment, deal risk, coaching gaps | Who needs help, which deals need intervention | Daily + weekly | Where should I invest coaching time? |
| RevOps / Sales Ops | Stage conversion rates, data quality scores, process compliance | Where is the system breaking? | Weekly + monthly | What do I fix before it hits revenue? |
| CRM Admins | Capture rates, sync errors, field completeness, adoption metrics | Is the plumbing working? | Weekly | Is the data foundation intact? |
| CROs / C-Suite | Coverage vs. target, forecast confidence, risk concentration, trajectory | Are we going to hit the number? | Weekly + quarterly | What do I tell the board? |
ive Mistakes That Quietly Kill Pipeline Visibility
Challenges are external obstacles. Mistakes are self-inflicted patterns, and every one of them is fixable.
- Trusting CRM data without validating it. A deal marked “Commit” may have had zero buyer contact in 30 days. The CRM says it is active while the interaction data says otherwise. The fix: cross-reference CRM stages against actual activity data, and let the interaction record win when the two disagree.
- Building dashboards before fixing data. Investing in analytics and BI tools before solving the underlying capture problem produces beautiful, misleading charts. A dashboard that visualizes incomplete records is a beautiful lie. The fix: complete Steps 1–3 of the framework (audit, standardize, automate) before spending a dollar on visualization.
- Measuring activity volume instead of engagement quality. Counting emails sent or calls made as indicators of deal health rewards gaming. A deal with 50 unanswered emails is far weaker than one with five substantive, two-way exchanges. The fix: track response rates, multi-threading depth, stakeholder breadth, and buyer-initiated interactions instead.
- Running pipeline reviews on stale data. Reviewing pipeline with data that was last updated three days ago means discussing deals that may have already changed. The fix: ensure pipeline review data stays real-time or near-real-time through automated capture and signal-based alerts.
- Ignoring the buyer’s perspective entirely. Building visibility around seller activity and internal stages creates a seller’s version of reality, and a deal can sit in “Negotiation” internally while the buyer is still evaluating three other vendors. The fix: layer buyer signals (engagement patterns, content consumption, response latency, stakeholder involvement) alongside internal stage progression.
Turning Pipeline Visibility Into Revenue Action
Pipeline visibility is a capability built on complete data capture, standardized processes, the right technology, and a commitment to acting on what the data reveals. It is the opposite of a dashboard or a Friday afternoon report.
The chain running through this entire guide: data capture → data quality → pipeline visibility → accurate forecasting → revenue growth. Fix capture, and every other number starts telling the truth.
What to take away:
- Pipeline visibility is a data-capture problem first and a dashboard problem second.
- True visibility needs completeness, accuracy, and timeliness, all three working simultaneously.
- Six metrics prove whether visibility is real: coverage ratio, velocity, stage conversion, deal aging, engagement scoring, and forecast accuracy.
- A seven-step framework (audit → standardize → automate → dashboard → review → AI → iterate) gives you the path.
- Different roles need different views. Build for each persona individually.
For organizations ready to move from seeing their pipeline to acting on it, Revenue Grid’s Revenue Action Platform delivers 360-degree pipeline visibility through automated activity capture, native CRM integration, and AI-driven deal guidance, from the data layer up.
What is pipeline visibility in sales?
Pipeline visibility is the real-time ability to see the status, health, and trajectory of every deal in a sales pipeline, including interaction history, stakeholder involvement, and closing probability. It differs from pipeline management (acting on deals) and pipeline reporting (analyzing past performance). True visibility requires complete, accurate, and timely data across every active opportunity.
Why is pipeline visibility important for sales forecasting?
Forecasts are only as accurate as the data they are built on. Without visibility into deal health, engagement levels, and real-time stage progression, forecasts rely on assumptions instead of evidence. The chain is direct: data quality drives visibility, visibility drives forecast accuracy, and forecast accuracy drives the confidence leadership needs to plan hiring, marketing spend, and operations.
How can I improve pipeline visibility in my CRM?
Start with a data quality audit to measure what percentage of interactions are actually logged. Then standardize deal stages with objective exit criteria, implement automated activity capture to eliminate manual logging (the highest-leverage single step), build role-specific dashboards, establish tiered review cadences, and layer in AI-driven signals. Capture fixes the data completeness problem that undermines everything else.
What metrics should I track for pipeline visibility?
Six metrics: pipeline coverage ratio (pipeline value ÷ target), pipeline velocity (opportunities × deal value × win rate ÷ cycle length), stage conversion rates, deal aging and stage duration, engagement scoring, and forecast accuracy over time. Track them together because any single metric in isolation gives a distorted view.
What is the difference between pipeline visibility and pipeline management?
Visibility is seeing what is happening across the pipeline in real time. Management is acting on that information: coaching reps, advancing deals, and reallocating resources. Visibility comes first because you can only manage what you can see. Managing a pipeline without visibility is like driving without a dashboard. You can steer, yet you have zero idea of your speed, fuel level, or engine temperature.
What tools help with sales pipeline visibility?
The technology stack includes CRM platforms (Salesforce, Dynamics, SAP, Oracle) as the system of record, activity capture tools for data completeness, Revenue Action Platforms for unified analytics and AI, conversation intelligence for call insights, and BI dashboards for visualization. Combining these in a unified platform outperforms a patchwork of point solutions.
How does automated activity capture improve pipeline visibility?
Manual data entry captures only a fraction of buyer-seller interactions. Automated activity capture logs emails, meetings, calls, and other interactions into the correct CRM records with zero rep effort. The result is a pipeline that reflects every interaction, every stakeholder, and every engagement signal rather than a partial version filtered through rep memory and motivation.
What is a Revenue Action Platform?
Recognized by Gartner in its first Magic Quadrant for Revenue Action Orchestration (December 2025), Revenue Action Platforms combine data capture, pipeline analytics, AI-driven insights, and workflow automation in a unified system. They go beyond showing what is in the pipeline to enabling teams to act on it by surfacing risk signals, recommending next steps, and automating routine tasks. The category evolved from Revenue Intelligence Platforms, adding the action layer that turns insight into execution.