
Key Takeaway
- Revenue forecasting in Salesforce rolls up opportunity data into quarterly revenue predictions using five forecast types and six forecast categories.
- Only 7% of sales organizations achieve 90%+ forecast accuracy (Gartner, 2024), and 4 in 5 leaders missed at least one quarterly forecast in the past year (Xactly, 2024).
- The root cause is incomplete CRM data, low rep adoption, and missing activity signals — not the tool itself.
- Revenue intelligence platforms layer automated activity capture, deal-health signals, and pacing analytics on top of Salesforce to close the accuracy gap.
- Vapotherm saved 761 person-days in year one through automated activity capture. Slalom found a 1% increase in meeting volume translated to $30M in incremental sales.
Revenue forecasting in Salesforce is the foundation of every quarterly call, board deck, and headcount plan at thousands of B2B companies. It ships free with every Sales Cloud license. It is the default revenue prediction engine for mid-market and enterprise sales teams.
It is also, by every available measure, falling short.
Gartner’s 2024 research on forecast accuracy and AI found that only 7% of sales organizations hit 90% or higher forecast accuracy. Xactly’s 2024 Benchmark Report confirmed the gap: 4 in 5 sales and finance leaders had missed a quarterly forecast in the past year.
The problem is structural. Salesforce offers collaborative forecasting, custom types, quota management, and Einstein overlays. The revenue forecast is only as accurate as the data feeding it — and that data depends on rep behavior, pipeline hygiene, and activity capture. Three areas where the native tool has hard limits.
This guide answers nine questions every revenue leader should be asking about forecasting inside Salesforce, from setup to accuracy to when you need something more.

Figure 1: The state of revenue forecasting accuracy in 2026. Sources: Gartner (2024), Xactly (2024), Salesforce State of Sales (2024).
What Is Revenue Forecasting in Salesforce?
Revenue forecasting in Salesforce is the built-in Sales Cloud capability that predicts future revenue by rolling up data from open opportunities through a hierarchy of reps, managers, and executives. Each opportunity is assigned a forecast category based on its stage. Managers adjust the roll-up at each level. The result is a single revenue number submitted to leadership as the quarterly call.
This differs from pipeline management, which tracks the total value of all open opportunities regardless of close likelihood. Salesforce’s own documentation on pipeline vs. forecasting draws the line clearly: pipeline is volume, forecast is prediction. A $10M pipeline might yield a $3M revenue forecast if only a portion of deals are in Commit or Best Case.
For subscription-heavy SaaS companies, a second distinction matters. Salesforce revenue forecasting in its fullest sense, predicting when revenue will be recognized across renewals, expansions, and multi-year contracts, goes beyond opportunity-level forecasting. Revenue Grid’s revenue forecasting models guide covers this distinction in depth.
Which Forecast Type Fits Your Sales Motion?
Salesforce supports up to four active forecast types simultaneously (extendable to seven via Salesforce Support). Choosing the right one shapes the accuracy and granularity of every revenue forecast your team produces.
- Revenue (Amount) forecasting is the default for most B2B teams. It rolls up the opportunity Amount field into a total expected revenue number per period.
- Quantity forecasting tracks unit volume instead of dollar value. It suits high-velocity sales motions where volume signals health more directly than revenue.
- Product Family forecasting breaks the revenue forecast down by product line, giving leadership visibility into which products drive pipeline.
- Opportunity Splits forecasting distributes credit proportionally in team-selling environments. Collaborative forecasting in Salesforce must be enabled for this type.
- Custom forecast types cover territory, segment, or renewal-based forecasting using custom date and measure fields.

Figure 2: Match your sales motion to the right Salesforce forecast type.
A mid-market SaaS company with 50 reps and overlapping territories might need Product Family plus Opportunity Splits running simultaneously. Revenue Grid’s sales forecasting product layers pacing and accuracy analytics on top of any forecast type without requiring configuration changes.
How Do Forecast Categories Shape Your Revenue Predictions?
Forecast categories are the confidence bands that group every opportunity into a single revenue forecast view. There are six defaults: Pipeline (early stage, low probability), Best Case (could close under favorable conditions), Commit (rep-confident), Most Likely (optional middle tier), Closed (won), and Omitted (excluded).
Each opportunity stage maps to exactly one category. This mapping drives the entire forecast. A common mistake: mapping “Proposal Sent” to Commit. A sent proposal is Best Case at most — the deal hasn’t received verbal confirmation, budget approval, or legal review. Mapping it to Commit inflates the revenue forecast and erodes trust in the number.

Figure 3: Salesforce forecast categories from Pipeline to Closed. Each opportunity stage maps to one category.
Stage-to-category mapping should be reviewed quarterly. Revenue Grid’s pipeline tracking capabilities help RevOps teams monitor drift in real time, flagging deals stuck in Best Case for 90+ days or those with multiple close-date slips.
How Do You Set Up Revenue Forecasting in Salesforce?
The salesforce forecasting setup has five core steps. Each one has a decision point that affects every revenue forecast going forward.
Step 1: Configure roles and forecast hierarchy. Salesforce rolls up through the role hierarchy, not the org chart. Misaligned hierarchies produce roll-ups that skip managers or double-count deals.
Step 2: Choose your forecast type(s). Navigate to Setup → Forecast Settings → Enable Forecasts. Critical detail: once activated, changing a forecast type requires a reset that wipes historical data.
Step 3: Enable quotas and forecast adjustments. Quotas are imported via CSV or set manually. Forecast adjustments let managers override the roll-up. The adjustment audit trail shows who changed the number, when, and by how much.
Step 4: Customize stage-to-category mapping. Test with a sample of 20 closed-won deals from last quarter. Do their historical stage progressions map cleanly to your configured categories? If not, adjust before going live.
Step 5: Decide between individual and cumulative roll-ups. Board-facing revenue forecasts typically use cumulative. Weekly forecast calls use individual. You can enable both.
Salesforce forecast override is available at every hierarchy level. Revenue Grid’s Salesforce and email integration provides the underlying activity data that makes these overrides evidence-based rather than political.
Why Do Revenue Forecasts in Salesforce Still Miss the Mark?
This is the question most forecasting guides avoid. The setup is correct. Categories are mapped. Quotas are loaded. The revenue forecast still misses by double digits. The salesforce forecasting limitations that cause this are structural, not configurational.
Rep self-reported stage data is the weakest input. A rep marks a deal as “Negotiation” when they’ve sent a pricing email. The buyer hasn’t responded. No champion is identified. Salesforce has no mechanism to verify this — it accepts whatever the rep enters.
CRM records are overwhelmingly incomplete. Validity’s 2025 State of CRM Data Management report found that 76% of CRM entries are less than half complete. Missing close dates, blank next-step fields, stale contacts — each gap degrades the forecast. Salesforce’s own State of Sales report shows reps spend only 28% of their week selling. The rest goes to admin tasks and manual data entry they consistently deprioritize.
The spreadsheet shadow forecast persists. Managers keep a parallel spreadsheet with their “real” numbers because Salesforce doesn’t reflect what they know from email threads and deal-review calls.
Engagement signals live outside Salesforce. How many emails has the buyer sent this week? Did the economic buyer attend the last meeting? Einstein Activity Capture attempts to bridge this gap, but its pre-Summer 2025 architecture stored data outside Salesforce, creating compliance concerns for regulated industries.
Close-date slippage is invisible until too late. A deal pushed from March 31 to April 15 to May 1 erodes the quarterly forecast, but Salesforce doesn’t surface slippage patterns proactively. Revenue Grid’s Revenue Signals alerts managers when deals slip or engagement goes cold.

Figure 4: Seven questions to audit your revenue forecast accuracy. If you check three or more, your forecast inputs need work.
What Does an Inaccurate Revenue Forecast Actually Cost Your Team?
Revenue forecast inaccuracy cascades differently through every layer of the organization. The costs are specific to each role.
For the VP of Sales / CRO
A missed revenue forecast is a credibility event. If the board number comes in 10–15% below call, consequences compound: guidance corrections, lost leverage for headcount, and a CFO who starts building a parallel model. Gartner’s research confirms that fewer than half of sales leaders have high confidence in their forecast accuracy.
For the Head of RevOps
RevOps owns the forecast infrastructure without owning rep behavior. When the quarter misses, RevOps absorbs the blame — spending end-of-quarter days reconciling Salesforce roll-ups with manager spreadsheets and explaining variance to the CFO without authority to change the inputs.
For the Director of Sales
Coaching becomes guesswork. A Director can’t tell which reps are sandbagging and which are struggling. Research cited by Challenger Inc indicates the average pipeline review takes 53+ minutes — most spent listening to reps narrate deal status that activity data could verify in seconds.

Figure 5: Revenue forecast inaccuracy hits each role differently. The CRO loses board credibility. RevOps reconciles zombie deals. Directors coach blind.
Slalom’s experience illustrates the scale. After implementing Revenue Grid, a 1% increase in meeting volume translated to $30M in incremental sales, and a 1% increase in conversion rate meant $60M in additional revenue. These are the direct result of making invisible pipeline activity visible.
How Can You Improve Revenue Forecast Accuracy in Salesforce?
The practices below focus on what the data shows actually moves forecast accuracy — not hygiene rules that sound reasonable and change nothing.
Run a CRM data detox before your next forecast cycle.
Pull every open opportunity with a close date in the current quarter. Flag deals with pushed close dates, no activity in 14+ days, or unchanged Amount fields. Quarantine them into a “Needs Review” view. Revenue Grid’s True Pipeline product automates this quarantine process.
Automate what reps will not do manually.
Reps will not log every email, meeting, and call. The solution is automated activity capture that syncs data without rep effort. Vapotherm captured 110,000+ emails and 27,000 calendar events in year one, saving 761 person-days of manual entry and more than $175,000 in labor costs.
Add deal context Salesforce cannot see.
Engagement velocity, multi-threading depth, and response time patterns predict outcomes more reliably than self-reported stage data. Revenue Grid’s Deal Guidance and AI-driven pipeline signals surface these patterns inside Salesforce.
Establish a forecasting cadence with clear accountability.
Weekly: reps update top 10 deals and flag risks. Biweekly: managers submit roll-ups with change narratives. Monthly: RevOps runs variance analysis. Quarterly: the CRO, CFO, and Head of RevOps align on methodology changes. This cadence turns revenue forecasting in Salesforce from a quarter-end scramble into a continuous practice.
Layer AI as a second opinion, not a decision-maker.
AI forecasting in Salesforce works best as a check on human judgment. The AI says $4.2M; the manager says $4.8M. That gap is the conversation worth having. Revenue Grid’s Mentor delivers this by flagging where manager confidence exceeds what the data supports.
When Does Salesforce Need a Revenue Intelligence Layer?
Native Salesforce forecasting provides a standardized roll-up framework, a common forecast-category language, and integration with Reports and Dashboards. For small teams with simple sales cycles, it may be enough.
The ceiling appears when revenue forecast accuracy depends on data Salesforce does not have.
Salesforce does not capture email or calendar activity automatically in a way that is reportable, native, and compliant with regulated-industry requirements. Organizations in financial services, healthcare, or government still face architectural constraints around where Einstein Activity Capture stores data.
Salesforce does not score deal health. It shows stage and amount — not whether the buyer’s response time has doubled, whether the economic sponsor dropped off, or whether a competitor surfaced in the last email thread.
Salesforce does not provide pacing analytics. A rep at 60% of quota on day 45 might be on track or in serious trouble, depending on their historical close pattern. Most RevOps teams build this analysis in spreadsheets because native reporting is too rigid.
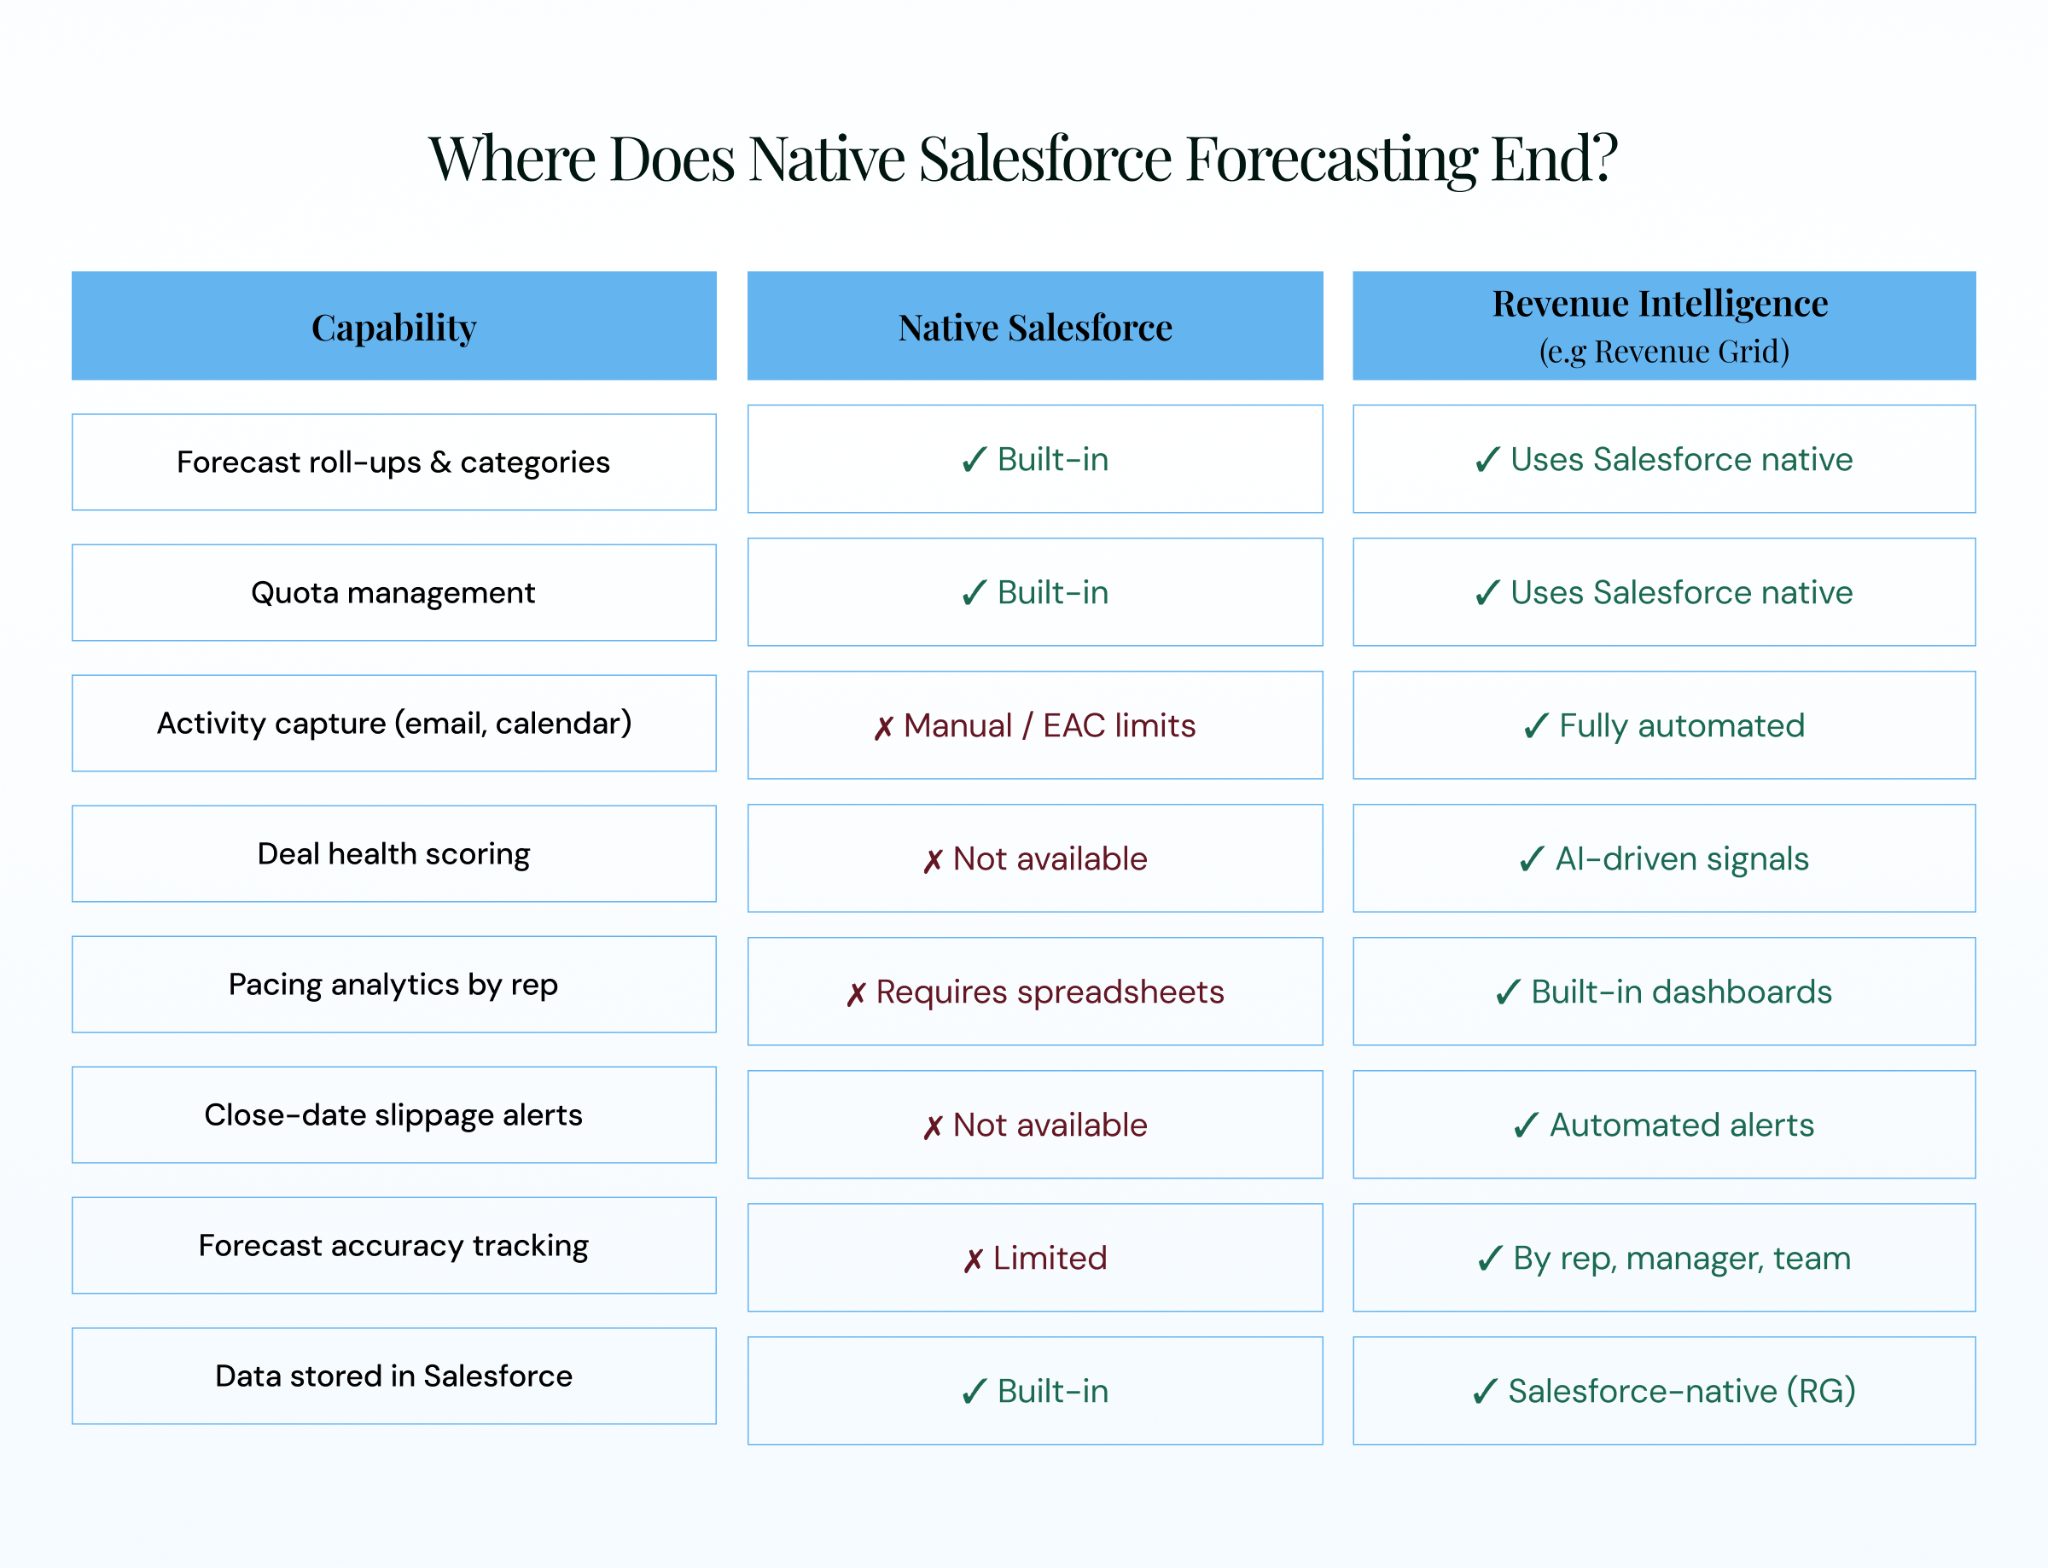
Figure 6: Native Salesforce forecasting vs. revenue intelligence. The green checkmarks show where the capability gap lives.
The architecture distinction matters: does the platform store data inside Salesforce (fully native) or in a separate layer (overlay)? Revenue Grid’s Salesforce-native approach means no data silos, no sync delays, and no compliance gaps.
How Does Revenue Grid Close the Forecast Accuracy Gap?
Revenue Grid is a revenue intelligence platform built natively inside Salesforce. It does not replace Salesforce forecasting. It fixes the inputs that make revenue forecasting in Salesforce unreliable.
-
- Automated activity capture logs every email, meeting, and call into standard Salesforce objects — zero rep effort, fully reportable, fully auditable.
- AI-driven deal health and Revenue Signals alert managers when deals show risk: declining response times, missing stakeholders, slipped close dates, stalled progression. A Director can say “Acme’s executive sponsor hasn’t responded in 11 days” instead of asking “How’s the Acme deal?”
- Forecast accuracy tracking by rep, manager, and team creates a longitudinal record that transforms revenue forecast reviews from negotiations into calibration exercises.
- Salesforce-native architecture means no AWS-side data silo, no middleware layer. Revenue Grid data lives in Salesforce, respecting sharing rules, security models, and compliance frameworks.
- The results: Rand Simulation increased new logo pipeline by 25% in 12 months. Revenue Grid maintains a 95% customer retention rate, was named a Major Player in the IDC MarketScape 2024, and holds a G2 rating of 4.6/5 across 573+ reviews.
See how Revenue Grid makes your revenue forecast accurate.
What is the difference between pipeline and forecast in Salesforce?
Pipeline is the total dollar value of all open opportunities regardless of close likelihood. A revenue forecast is the subset expected to close, filtered by category and adjusted by managers. A healthy ratio is 3:1 to 4:1 for B2B SaaS companies with 30+ day sales cycles.
How accurate is revenue forecasting in Salesforce?
Accuracy depends entirely on data quality and process discipline. The tool is not the bottleneck — incomplete CRM data, inconsistent stage definitions, and missing activity signals are the primary accuracy killers. Revenue Grid’s forecasting accuracy guide covers the specific fixes.
What are quotas and forecast adjustments in Salesforce?
Quotas are revenue targets per rep per period, imported via CSV or set manually. Forecast adjustments let managers override roll-ups when they have context the data doesn’t yet reflect. Adjustments create an audit trail.
Can I use Einstein with revenue forecasting in Salesforce?
Yes. Einstein Forecasting adds a machine-learning layer that analyzes historical close rates and pipeline patterns to produce an AI-predicted number alongside the human-submitted forecast. Limitations: it requires 24+ months of data, minimum opportunity volume, and — on legacy configurations — stored some activity data outside core Salesforce.
Do I need a revenue intelligence platform on top of Salesforce?
If your team has fewer than 20 reps and a simple sales cycle with consistently accurate forecasts, native Salesforce may be enough. If forecasts regularly miss by 10%+ and reps spend more time on admin than selling, you are hitting the native ceiling. Revenue intelligence fills the gap with automated activity capture, deal-health scoring, and pacing analytics — all inside Salesforce.