
Key Takeaway
- Revenue forecasting is about having clean, complete data underneath it. A sophisticated forecasting method built on inconsistent CRM records will still produce unreliable numbers.
- Pipeline-based and bottom-up forecasting are the most grounded in deal reality, but they depend heavily on reps logging activity consistently which most teams struggle with.
- No single model is enough. The most accurate forecasts blend quantitative methods (pipeline, time series, linear regression) with qualitative inputs (executive judgment, market research) to account for both the data and the context around it.
- Forecast accuracy is a lagging indicator of process quality. If your numbers are consistently off, the root cause is almost always upstream in how data is captured, staged, and reviewed.
- Relationship health is the variable most forecasting models don't account for. A deal at the right stage with the right dollar value can still slip if the key stakeholder has gone quiet and that signal rarely lives in your CRM.
Revenue forecasting is the practice of estimating how much money your team or company will bring in over a specific period. That could be next month, next quarter, or the full year.
As a salesperson, you already have most of the information you need. You know which deals are in your sales pipeline, how far along each one is, which prospects are engaged, which ones are losing interest, and how long your typical sales cycle runs. Revenue forecasting takes all of that internal data and gives you the best-informed estimate of future sales.
In this article, we’ll walk through 9 revenue forecasting models, from simple methods you can run in a spreadsheet to more advanced statistical approaches. For each one, you’ll see how it works, when to use it, and where it falls short. We’ll also cover the sales forecasting software that supports these models and how relationship intelligence plays a role in making your forecasts more reliable.
Let’s start by understanding how effective revenue forecasting actually helps you.
How Does Revenue Forecasting Help You?
Revenue forecasting helps you answer some key questions:
- Whether you’re on track to meet your sales quota
- Whether you need to increase your activity or shift focus to specific deals
- Whether your manager’s team is going to meet the company’s targets
- Whether leadership should hire more reps, enter a new market, or adjust spending
Instead of waiting until the end of the quarter to find out where you landed, you can see the trajectory early and make adjustments while there’s still time. This is why understanding why revenue forecasting is important goes beyond simple number-crunching. It directly drives financial planning, resource allocation, and business strategy.
Let’s see it with an example. Say you’re a SaaS rep and it’s the start of Q2. You look at your pipeline, and you’ve got five deals in play at different stages. Based on your historical close rates, you assign a probability to each one.
- Two late-stage deals worth $30,000 each, with an 80% close rate: $60,000 x 0.80 = $48,000
- Two mid-stage deals worth $20,000 each, with a 40% close rate: $40,000 x 0.40 = $16,000
- One early-stage deal worth $50,000, with a 10% close rate: $50,000 x 0.10 = $5,000
Your total expected revenue for the quarter comes to $69,000.
If your sales quota is $80,000, you can immediately see an $11,000 gap. That tells you that you either need to accelerate those mid-stage deals and move them closer to a commitment, or you need to generate new pipeline to cover the shortfall. Without the forecast, you might not have recognized that gap until the final weeks of the quarter, when it’s too late to recover.
What are the 9 Types of Revenue Forecasting Models?
There are several approaches to forecasting revenue, each suited to different business types, data environments, and planning horizons. The 9 revenue forecasting models below cover a full range, from simple calculations you can do in a spreadsheet to more advanced statistical methods that require deeper data infrastructure.
1.Pipeline-Based Forecasting
Pipeline-based forecasting uses your active sales pipeline to predict future revenue. Each deal in your CRM is assigned a probability of closing based on the stage it’s currently in, and the weighted total across all deals gives you a forecasted revenue number.
Pipeline-based forecasting uses the current sales pipeline to predict future revenue by applying conversion probabilities at each deal stage, making it particularly useful for B2B companies with structured customer relationship management (CRM) data.
Say you have 3 deals: a $50,000 deal in negotiation (80% probability), a $30,000 deal at proposal stage (50%), and a $20,000 deal in discovery (10%). Your forecast would be:
- $50,000 x 0.80 = $40,000
- $30,000 x 0.50 = $15,000
- $20,000 x 0.10 = $2,000
Total forecasted revenue will be $57,000.
When to use it:
- Your team has a well-maintained CRM with clearly defined deal stages
- You’re forecasting short-term revenue, typically within the current quarter
- You’re in a B2B sales environment with a structured sales process
- Leadership needs visibility into what’s likely to close and when
This is one of the most hands-on forecasting models for salespeople because it’s built directly from the deals you’re working right now, not from abstract market data or historical trends. Sales leaders especially rely on this method to make informed decisions about quota attainment and near-term revenue growth.
How Revenue Grid Strengthens Pipeline-Based Forecasting
Pipeline-based forecasting requires your team to maintain accurate and up-to-date CRM records. If deal stages are loosely defined or reps aren’t logging their activity consistently, the numbers won’t be reliable. Poor data quality is one of the most common revenue forecasting mistakes: start with high-quality data, and invest in processes to collect accurate and complete revenue data.
Revenue Grid gives sales and RevOps teams visibility by tracking pipeline evolution over time, so you can see exactly which deals upgraded, which ones went idle, which slipped, and which were lost.
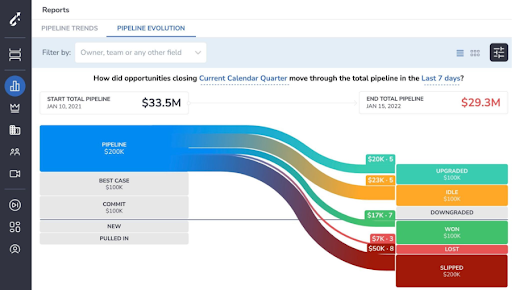
Instead of reviewing a flat list of deals in your CRM and assigning probabilities based on stage alone, Revenue Grid lets you:
- Track how your total pipeline changes week over week and where the movement is happening
- Identify deals that have stalled or downgraded before they quietly drop out of the forecast
- See the gap between your starting pipeline and where it actually ended up, broken down by outcome
- Filter by owner, team, or any other field to pinpoint which segments are driving or dragging performance
This turns pipeline forecasting from a point-in-time snapshot into a continuous, evolving view of your revenue trajectory.
2.Run Rate Forecasting
Run rate forecasting takes your current revenue over a recent period and extrapolates it forward. If your team closed $300,000 in Q1, your annual run rate would be $1.2 million. If you’re two months into Q2 and have closed $150,000, your projected quarter would be $225,000.
It’s a straightforward calculation that works well when revenue patterns are relatively stable. Sales teams often use it as a quick pulse check mid-quarter to see whether they’re trending toward or away from their target.
When to use it:
- You need a fast revenue estimate without building a detailed model
- Revenue has been relatively consistent month over month
- You’re mid-quarter and want to project where you’ll land by quarter end
- You’re in a subscription or recurring revenue business with low volatility
The trade-off is that it assumes conditions will remain constant, which is rarely the case. A strong month followed by a weak one can produce a misleading projection, and it won’t account for seasonality, shifting market conditions, or upcoming market shifts. External factors such as economic fluctuations can significantly impact revenue projections, making them unreliable if run rate is your only method.
3.Bottom-Up Forecasting
Bottom-up forecasting builds the revenue projection from the ground level. Individual sales reps, account managers, and team leads each submit their own estimates based on what they’re seeing in their territories, their pipeline health, their conversations with prospects, and their read on competitive dynamics. These individual projections are then aggregated upward to form the company-wide forecast.
This approach is particularly useful for companies with strong CRM data, as it relies on gathering insights from sales and account management teams to build revenue projections based on pipeline health and market conditions.
For example, in a company with three regional sales teams, each team lead would forecast their own region’s expected revenue:
- The West Coast team projects $400,000 based on two large enterprise deals nearing close.
- The East Coast team projects $350,000, driven by a strong mid-market pipeline.
- The Central team projects $200,000, noting slower activity due to a key competitor’s aggressive pricing in their territory.
Finance consolidates these into a company forecast of $950,000 and adjusts for any inconsistencies in assumptions across the three teams.
When to use it:
- Your organization has multiple sales teams, regions, or product lines
- You want the forecast to reflect ground-level realities rather than top-level assumptions
- You need buy-in from frontline teams on the targets they’re working toward
- Your business has enough internal structure to collect and consolidate inputs consistently
This approach requires strong cross-functional communication. Each team needs to follow a consistent methodology when building their estimates, or else the consolidated number can be skewed by one team being overly optimistic and another being too conservative. Human error in data entry and subjective judgments can introduce inaccuracies, which makes robust data validation protocols critical when rolling up bottom-up forecasts.
4.Top-Down Forecasting
Top-down forecasting works in the opposite direction of bottom-up. Leadership starts with a macro view and covers factors like total addressable market, industry growth rates, competitive positioning, and strategic goals and uses that to set a company-wide revenue target. That target is then divided across business units, regions, and teams.
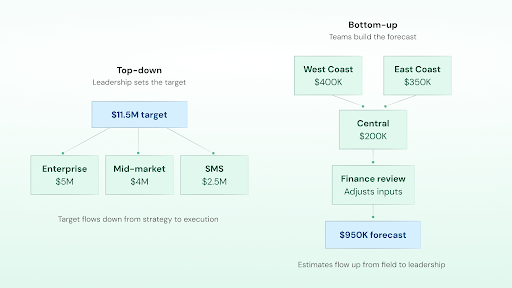
For example, if leadership determines the company should grow 15% year over year and last year’s revenue was $10 million, the target becomes $11.5 million. That number is then allocated to different teams: $5 million to the enterprise sales team, $4 million to mid-market, and $2.5 million to the SMB segment, based on each group’s historical contribution and growth potential.
When to use it:
- You’re entering a new market or launching a new product where ground-level data is limited
- Leadership needs to align the organization around a unified growth objective
- You’re doing long-range planning where strategic direction matters more than deal-level detail
- The company has a clear understanding of its market position and share
Top-down forecasting is a useful starting point for market expansion planning, but it can overlook micro-market realities. A regional team might know that a major competitor just entered their territory or that a key industry in their area is contracting, and those details won’t show up in a macro-level model. Shifts in customer behavior and preferences pose a particular challenge here, requiring businesses to continuously analyze market dynamics alongside top-down projections. That’s why many organizations pair top-down with bottom-up to get both strategic alignment and ground-level accuracy.
5.Linear Regression
Linear regression is a statistical method that analyzes historical data to understand how changes in key variables, such as marketing spend,impact revenue, providing a data-backed view into revenue drivers. It answers the question: when a specific input changes, how does revenue respond?
For example, a company might analyze two years of data and find that for every additional $10,000 spent on paid advertising, revenue increases by $25,000. Or that for every new sales rep hired, quarterly revenue increases by $40,000 after a ramp-up period. The model quantifies these relationships and uses them to project future revenue under different scenarios.
This requires access to clean, structured historical revenue data with enough volume to identify reliable patterns. If you only have a few months of data or your revenue drivers are inconsistent, the model won’t produce meaningful results. It also works best when the relationship between variables and revenue is relatively linear (a consistent, proportional effect).
When to use it:
- You have at least 12 to 24 months of historical data with clearly trackable variables
- You want to understand which specific inputs have the greatest impact on revenue
- You’re evaluating decisions like increasing headcount, raising prices, or scaling marketing spend
- You need a data-driven foundation to support a business case or budget request
Linear regression can miss non-linear dynamics. For instance, doubling your sales team doesn’t necessarily double revenue if the market is already saturated or if onboarding takes longer than expected. It also won’t capture sudden market shifts or one-time events that have no precedent in your historical data. In volatile markets, this is a particularly important limitation to keep in mind.
6.Time Series Analysis
Time series analysis examines your revenue data over time to identify patterns — trends, seasonal cycles, and recurring fluctuations — that can be projected forward. It breaks down your historical sales data into its underlying components so you can separate long-term growth from short-term noise and identify trends with greater precision.
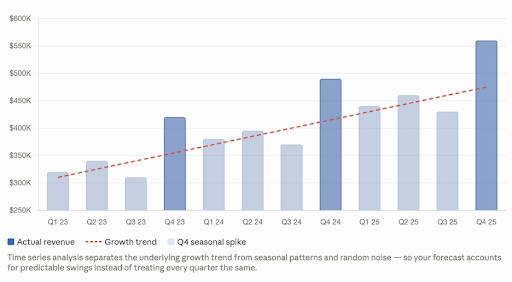
For example, a B2B software company might notice that Q4 revenue is consistently 20% higher than in other quarters because enterprise buyers tend to spend remaining budget before year-end. A media company might see subscription revenue dip every summer. Time series analysis captures these patterns and builds them into the forecast so you’re not caught off guard by predictable swings.
This model needs a sufficient history of revenue data (roughly 12 months) to detect reliable patterns. It works by analyzing past sales data and assuming those historical patterns will continue — which is both its strength and its weakness.
When to use it:
- Your business has recurring or subscription-based revenue
- You’ve observed seasonal or cyclical patterns in your sales data
- You want a forecast that adjusts for known fluctuations rather than treating every month the same
- You’re planning for resource allocation, inventory, or capacity across different periods
Time series models struggle with events that have no historical precedent. A sudden regulatory change, a new competitor entering the market, or a global disruption won’t appear in your past revenue data, so the model can’t account for them. Economic indicators and external events can significantly impact revenue projections in ways that historical analysis alone cannot predict. Combining time series with qualitative judgment from your team helps fill that gap.
How Revenue Grid Supports Time Series Forecasting
Time series analysis is most effective when you can visualize how your revenue data is shifting week over week, rather than reviewing it in a static table at the end of the quarter. Revenue Grid’s Forecast Chart does exactly that. It plots your Closed Won, Commit, Best Case, and Pipeline values on a weekly timeline against your quota, so trends and deviations become visible as they develop.

With this view, you can:
- Spot weeks where committed revenue dipped and investigate what caused the drop before it compounds
- Compare adjusted forecasts against original commits to see how accurate your team’s calls have been
- See at a glance whether you’re trending toward or away from quota as the quarter progresses
Instead of waiting to analyze patterns retroactively, this gives you a living time series of your forecast that updates as deals move, so you can act on the trend while it’s still forming.
7.Moving Average Forecasting
Moving average forecasting smooths out short-term fluctuations in your revenue data by averaging results over a set number of recent periods. Instead of reacting to every spike or dip, it gives you a steadier view of where revenue is trending.
For example, if your monthly revenue over the past four months was $80,000, $95,000, $70,000, and $90,000, a four-month moving average would place your projected next month at $83,750. This average revenue figure gives a more stable baseline than any single month’s performance.
This model is simple to calculate and easy to explain, which makes it useful for quick internal conversations about direction. It does not require advanced tools or statistical expertise. A spreadsheet is enough.
When to use it:
- You want a simple, low-effort method to smooth out month-to-month volatility
- Your revenue doesn’t have strong seasonal patterns that need to be modeled separately
- You’re looking for a quick directional indicator rather than a precise projection
- You’re working with limited data or limited access to analytics tools
Moving average forecasting is backward-looking by design. It tells you where things have been, not necessarily where they’re going. It won’t pick up on emerging trends quickly, and if your business is going through a period of rapid change — whether from shifting market trends, new marketing campaigns, or changes in marketing strategies — the average will lag behind reality.
8.Cohort-Based Forecasting
Cohort-based forecasting groups customers by a shared characteristic, most commonly the time period in which they were acquired, and tracks how each group contributes to revenue over time. This allows you to see patterns in customer behavior that get lost when you look at total revenue as a single number.
For example, you might find that customers acquired in Q1 2025 generated $200,000 in their first year, while the Q3 2025 cohort generated $260,000 in the same timeframe. That tells you something changed. Perhaps your sales team improved its targeting, or a product update increased the value delivered to new customers. You can then apply the more recent cohort’s revenue pattern to project what newly acquired customers are likely to generate going forward.
This model is particularly valuable for subscription and SaaS businesses where customer lifetime value, retention, and expansion revenue matter as much as new bookings. A data-driven approach to cohort analysis lets you generate accurate revenue projections based on actual behavioral patterns rather than assumptions. It requires you to segment your customer data by acquisition period and track revenue per cohort over time, which means your CRM and billing systems need to support that level of reporting.
When to use it:
- You’re in a subscription, SaaS, or recurring revenue business
- You want to understand how customer value evolves after acquisition
- Retention and expansion revenue are significant parts of your total revenue
- You need to forecast not just new sales, but ongoing revenue from existing customer groups
Cohort-based forecasting assumes that newer cohorts will behave similarly to older ones, which may not hold true if your product, pricing, or market conditions have shifted significantly. It also requires clean, well-segmented data, and building those segments retroactively can be time-consuming if your systems weren’t set up for it from the start.
9.Scenario Planning
Scenario planning builds multiple versions of your revenue forecast based on different sets of assumptions. Rather than committing to a single number, you model what revenue would look like under a best case, a base case, and a worst case.
For example, a base case might project 10% growth based on current pipeline strength and historical conversion rates. The best case might assume a 20% growth rate, factoring in a successful product launch and faster deal cycles. The worst case might project flat or negative growth, accounting for the possibility of losing a major account, an economic slowdown, or a delayed product release.
Each scenario is built on clearly stated assumptions, and the value is not in predicting which one will happen, but in preparing for a range of outcomes. Leadership can use the best case to plan for investment opportunities or to identify where to cut if needed. Sales teams can use the base case as their working target while keeping an eye on the triggers that would push performance toward either end.
When to use it:
- Your business operates in a volatile or unpredictable market
- You’re preparing for board presentations, investor conversations, or strategic planning sessions
- You need to stress-test your forecast against different economic or competitive conditions
- You want to build contingency plans for resource allocation and budgeting
Scenario planning can become unmanageable if you define too many scenarios or if the assumptions behind each one aren’t clearly documented. It also doesn’t tell you which scenario is most likely, so teams sometimes struggle with which version to act on. Keeping it to three well-defined scenarios and revisiting them quarterly tends to produce the most practical results.
Qualitative Forecasting Methods: A Different Angle on Future Revenue
The models above are largely quantitative, they rely on historical data, conversion rates, and statistical relationships. But not every forecasting situation has clean historical data to work with. That’s where qualitative forecasting methods come in.
Qualitative techniques are particularly useful for new products lacking sufficient historical data, market expansion into unfamiliar territories, or situations where current market trends are diverging sharply from past revenue trends. Two of the most commonly used qualitative methods are the Delphi Method and market research.
The Delphi Method
The Delphi Method gathers anonymous opinions from a panel of experts through multiple rounds of structured questioning until a consensus is reached. Rather than holding a group discussion where louder voices dominate, each expert responds independently. Their aggregated responses are shared back with the group, and they revise their estimates in subsequent rounds until the group converges on a reliable revenue forecast.
Advantages: The Delphi Method reduces individual bias and incorporates diverse perspectives without requiring physical meetings. This makes it practical for distributed teams and organizations that rely on external advisors or industry specialists.
Disadvantages: It can be time-consuming, particularly when multiple rounds are needed to reach consensus. There’s also a risk that the majority opinion unfairly sways the minority, which can suppress important outlier perspectives that might be closer to the truth.
Jury of Executive Opinion
A related qualitative approach, the jury of executive opinion pools the views of senior leaders in sales, finance, marketing, and operations into a collective revenue estimate. This method draws on cross-functional experience and is particularly useful for long-range planning where market research data is limited.
Market Research
Market research involves using surveys, focus groups, and customer interviews to gauge future demand directly from the source: the market. This approach is especially valuable when entering new segments or launching new products where past sales data simply doesn’t exist.
When combined with quantitative forecasting methods such as using market research findings to validate or adjust a linear regression model , qualitative methods significantly improve forecasting accuracy.
The Straight-Line Method: Simplest Quantitative Approach
Worth mentioning separately because of how widely it’s still used: the straight-line method assumes revenue will continue to grow at a constant historical rate. If your business grew at 10% per year for the past three years, the model projects that same 10% growth into the future.
It’s the fastest way to generate a revenue projection, and it works reasonably well in stable markets. The obvious limitation is that it takes a single historical growth rate and applies it indefinitely, ignoring seasonality, market dynamics, competitive changes, and virtually every external factor that could affect future revenue growth. Use it as a starting point, not a final answer.
Common Revenue Forecasting Mistakes to Avoid
Even experienced sales leaders make these forecasting errors. Understanding common revenue forecasting mistakes is the first step toward building a more reliable revenue forecasting process.
Relying on a Single Forecasting Method
No single model captures the full picture. Combining multiple forecasting methods creates a more reliable prediction. Blending quantitative and qualitative approaches can account for both hard data and market dynamics. For example, pairing pipeline-based forecasting with the Delphi Method gives you both deal-level precision and expert perspective.
Using Poor-Quality Data
Poor data quality leads directly to inaccurate forecasts. Start with high-quality data, and invest in processes to collect accurate and complete revenue data. Human error in data entry and subjective judgments can introduce significant inaccuracies, which makes robust data validation protocols essential.
Ignoring External Factors
External events like economic fluctuations, regulatory changes, competitive moves can significantly impact revenue projections, making them unreliable if you only look inward. Economic indicators, shifts in customer behavior, and current market trends all need to be factored into your forecasting process.
Treating the Forecast as Static
Forecasts are not set-it-and-forget-it documents. Regularly update forecasts based on new data to account for changes in market conditions, customer behavior, and internal factors. Monthly updates are recommended for accuracy, especially in fast-moving or volatile markets.
Pursuing Perfection Over Practicality
Avoid the futile bid for perfection. Focus on balancing usefulness and cost when selecting model sophistication to ensure your revenue predictions remain practical and actionable. A more complex model isn’t automatically better, it just takes longer to build and harder to explain to stakeholders.
Not Tracking Forecasting Accuracy
Develop a continuous improvement process for your forecasting model by comparing forecasts against actual performance and adjusting methods based on findings. Revenue forecasting accuracy doesn’t improve by accident, but rather, it improves through systematic review and iteration. This is especially true when working with historical performance data from publicly traded companies or industry benchmarks.
Revenue Forecasting Tools and Software
The models above give you the framework, but executing them consistently — especially across growing teams — requires the right sales forecasting software. Here are some commonly used platforms that support revenue forecasting in different ways.
CRM Platforms (Salesforce, HubSpot, Zoho CRM)
Most of the revenue forecasting process starts with CRM data: deal stages, close dates, deal values, and pipeline coverage. Salesforce in particular offers built-in forecasting features that allow roll-ups by team, product, and region. The forecasting accuracy of any model depends on the quality of data in your CRM, so this layer needs to be solid before anything else. Treat your CRM as the foundation of your internal data infrastructure.
Spreadsheet Tools (Excel, Google Sheets)
These are still widely used, especially for simpler models like run rate, moving average, and straight-line forecasting. They give you full control over formulas and assumptions. The trade-off is that they’re manual, difficult to version-control, and prone to errors as complexity grows. They work well as a starting point but struggle to scale as your data points multiply.
FP&A and Planning Platforms (Anaplan, Planful, Adaptive Planning)
These are designed for finance teams that need to build multi-scenario forecasts, model different assumptions, and consolidate inputs across departments. They’re well-suited for top-down and scenario planning approaches and are typically used at the organizational level rather than by individual sales teams. These platforms support more sophisticated predictive analytics and financial planning workflows.
Conversation and Activity Analytics (Gong, Clari)
These platforms analyze sales activity data — calls, emails, deal progression — to give leadership a more objective view of pipeline health. They help reduce reliance on self-reported deal stages by surfacing engagement patterns and deal movement. They’re a useful supplement to your core forecasting methods, particularly when trying to validate whether the expected revenue in your pipeline reflects actual buyer engagement.
Why Revenue Grid Should Be Part of Your Forecasting Stack
Every tool listed above helps you build, track, or refine your forecast. What most of them don’t do is tell you whether the relationships behind your deals are actually healthy. Because a trusted relationship leads to closed deals.
A deal can sit at the right stage with the right dollar value attached to it and still be at risk. A champion who’s gone quiet, a key stakeholder who’s disengaged, a handoff between sales and customer success where context was lost, these are the signals that determine whether a forecasted deal actually closes, and they don’t show up in a CRM field or a spreadsheet formula.
Revenue Grid is a relationship intelligence platform that surfaces exactly these signals. It sits across email, calendar, and CRM to build a real-time picture of how deals and accounts are actually progressing and not just how they’ve been logged. It captures fading engagement, multi-threading gaps in enterprise accounts, and follow-through patterns that would otherwise go unnoticed until a deal slips.
To help you build accurate revenue forecasts, Revenue Grid has a full forecasting module designed to fit the revenue forecasting process your team already runs.
Here’s what you get:
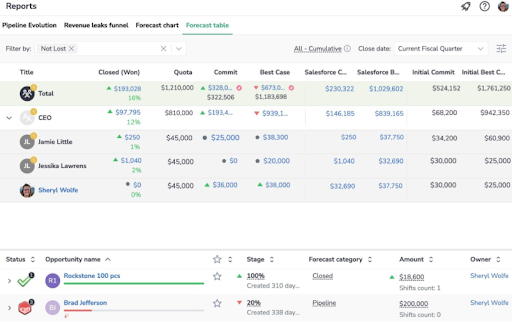
- An auto-populated forecasting table. Revenue Grid pulls together CRM forecasting, its own AI-driven signals, manager forecasts, and rep forecasts into a single prebuilt view. No spreadsheet assembly required.
- One-click drill-downs into the details. Every number in the forecast is clickable. You can go from a rolled-up projection straight into the deals behind it and see what’s driving the number, what’s changed, and what’s at risk.
- Week-over-week progression tracking. The module tracks how your forecast shifts over time and breaks down exactly which deals were added, dropped, or moved between categories.
- Pipeline movement dashboards. Visual dashboards show how the pipeline is flowing: what upgraded, what slipped, what went dark — so the team can forecast from what’s actually happening, not from a static snapshot.
Most teams treat relationship visibility and revenue forecasting as separate workflows, separate tools, separate tabs. Revenue Grid combines them. The relationship intelligence tells you whether your deals are real. The forecasting module tells you what that means for the number. Together, they give you a forecast you can explain, defend, and act on.
Book a demo with Revenue Grid to make better decisions based on an accurate revenue forecast.
What's the difference between revenue forecasting and sales forecasting?
They’re often used interchangeably, but there’s a distinction worth knowing. Sales forecasting typically focuses on predicting the volume or value of deals your team will close in a given period. Revenue forecasting can include recurring revenue, expansion revenue from existing accounts, and other income streams beyond new bookings. For most B2B sales teams, the two overlap significantly, but as your business scales into upsell and renewal motions, the difference becomes more operationally meaningful.
How many forecasting models should a team use at once?
Most mature revenue teams run two or three methods in parallel and cross-reference them. A common combination is pipeline-based forecasting for near-term visibility, time series analysis for identifying seasonal patterns, and scenario planning for stress-testing assumptions before board or investor conversations. Using a single model is the most common forecasting mistake. Each method has blind spots, and layering approaches compensate for what any one model misses.
How do you know if your forecasting model is actually working?
Track variance: the difference between what you forecast and what you actually close, measured consistently over multiple quarters. A reliable model produces variance under 10% on a rolling basis. If you’re consistently over- or under-forecasting, the problem is usually upstream, like either in data quality, how deal stages are defined, or how reps are submitting their calls. Variance analysis is the most direct way to diagnose which part of your process is breaking down.
At what stage should a company start building a formal forecasting process?
Earlier than most teams think. Even a 5-person sales team benefits from a basic pipeline-weighted forecast, because it creates the habit of reviewing deals with a critical eye rather than gut feel. Even a well-maintained spreadsheet with consistent stage definitions can outperform a complex tool built on bad CRM data. Complexity should follow data maturity, not the other way around.
Why do sales forecasts tend to be overly optimistic, and how do you correct for it?
Reps tend to forecast optimistically for two reasons: they genuinely believe in their deals, and there’s often an implicit pressure not to show a gap. The most effective correction is creating a process where deal health is evaluated against objective signals (engagement recency, stakeholder coverage, stage velocity) rather than rep sentiment alone. When reps know their forecast will be cross-referenced against actual activity data, the numbers tend to get more honest on their own.