

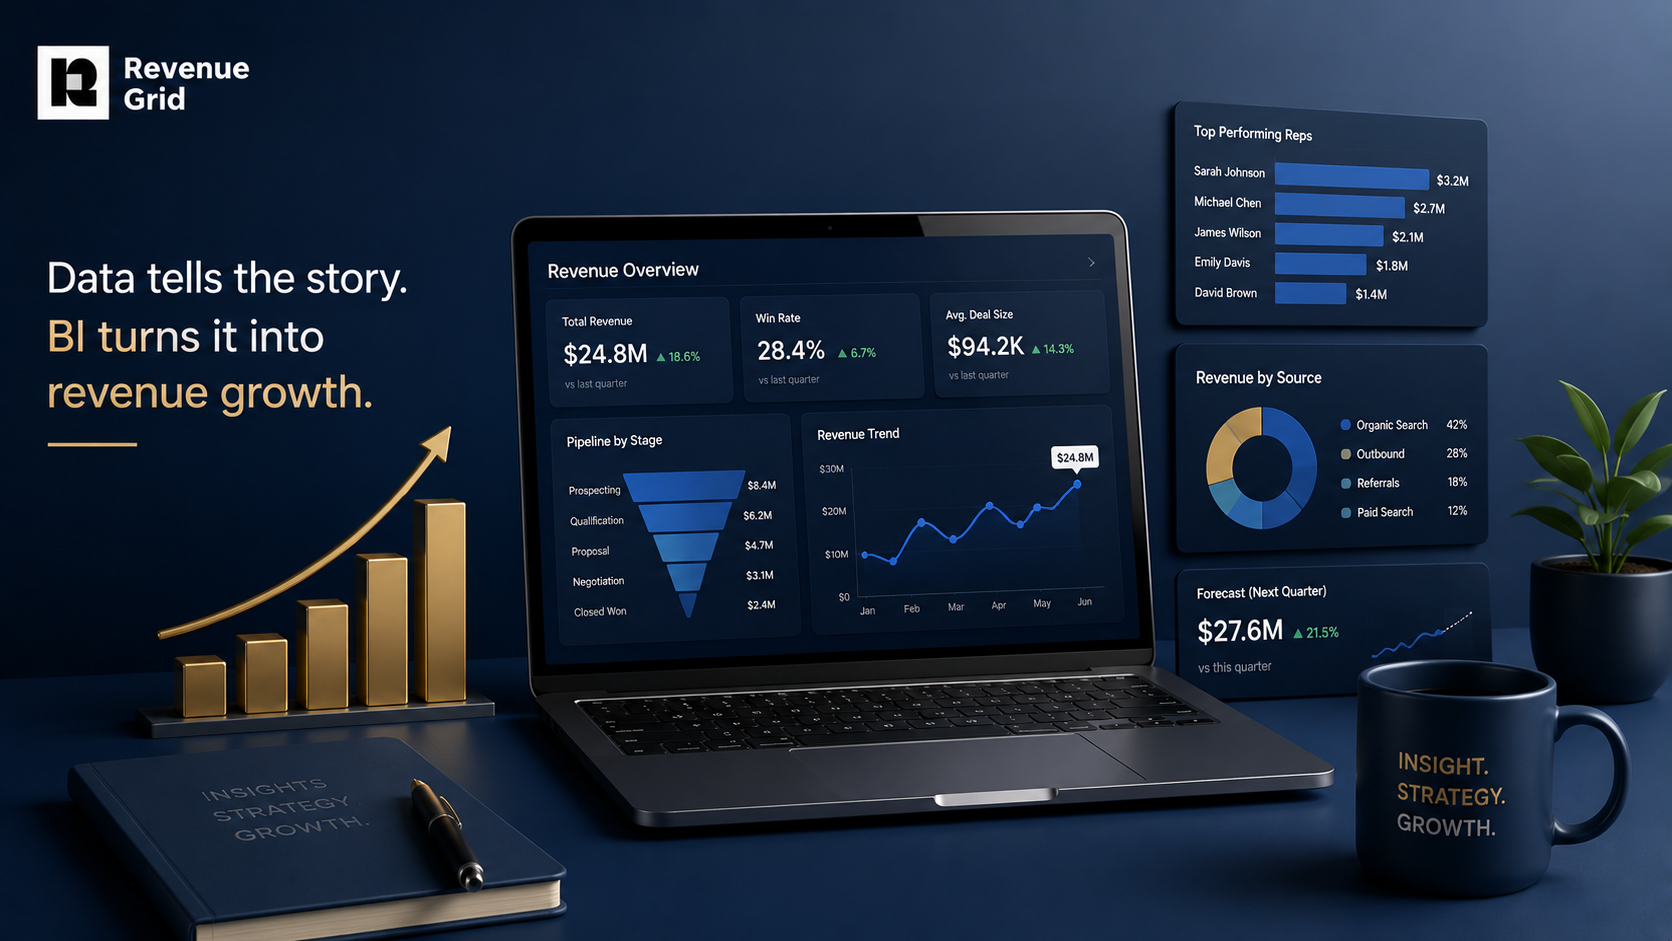
Key Takeaway
- BI reporting transforms data into actionable insights that drive revenue growth for B2B sales teams
- Choose the right BI tool based on integration capabilities, ease of use, and scalability
- Focus on data quality and user adoption to overcome common BI implementation challenges
- Start with clear objectives and involve stakeholders throughout the process
As a Sales Operations leader, you know that real competitive advantage comes from data-driven decisions. Today’s top-performing B2B revenue teams don’t just collect data—they act on it, with business intelligence as their playbook. Much like how Olympians with their trainers take advantage of Performance Analysis to improve decision-making to enhance their performance, B2B SaaS revenue leaders and Sales Operations Directors rely on business intelligence to win in today’s competitive market.
What is BI (Business Intelligence) reporting?
If you lead a B2B sales team, mastering BI reporting is critical to your revenue growth. There’s no way around it: These days, companies need big data. They thrive on it; the deeper they dig to find out what has been happening and how it’s happened, the more insight they have as to the “why’s” — and the more informed they become for future deals. In fact, according to Germany-based database company Statista, almost 53% of surveyed global organizations had adopted big data technology, with another 38% reporting intent to adopt it in the near future.
Business Intelligence reporting refers to the process of using advanced tools to harness critical data, create reports, and analyze data to create actionable insights — in other words, data sets that tell meaningful actions that can be taken based on data.
How Business Intelligence Reporting Works
Understanding the BI reporting process helps you implement it effectively in your organization. Here’s how it works:
- Data Collection: Gather data from multiple sources (CRM, email, marketing automation, financial systems)
- Data Integration: Combine and clean data to ensure accuracy and consistency
- Data Analysis: Apply analytics and AI to identify patterns, trends, and insights
- Visualization: Create dashboards and reports that make data easy to understand
- Distribution: Share insights with stakeholders for informed decision-making
Why is BI so important?
Business intelligence consists of a number of processes and methods of collecting and analyzing data. Analysts can leverage BI to provide guidance on how to make sales and marketing — and, in fact, the whole company — run more efficiently. With so many companies already implementing these practices, reporting and business intelligence has become critical to win against competitors — particularly in the B2B industry.
Types of Business Intelligence Reports
Different types of BI reports serve different purposes in your organization. Here are the main categories:
| Report Type | Purpose | Best For |
| Operational Reports | Track daily activities and KPIs | Sales managers monitoring pipeline |
| Analytical Reports | Deep-dive analysis and trends | Strategic planning and forecasting |
| Dashboard Reports | Real-time visual summaries | Executive overviews and team meetings |
| Ad Hoc Reports | Custom analysis for specific questions | Investigating specific opportunities or issues |
This comparison helps you choose the right report type for your specific business intelligence needs and stakeholder requirements.
BI reporting benefits
Let’s have a glance at just how in particular BI reporting tools can benefit a company:
- Increased workflow speed: Centralizing the data force minimizes knowledge delay between teams.
- Enhanced data quality: Not only does BI determine which data are critical but there’s typically a real-time dashboard to access data at any time.
- Analysis of customer behavior and market trends: Customers are more selective and informed than ever. Business intelligence reports reveal customer values, demands, pain points, and activities.
- Optimized operations and forecasting: Predictive analytics and artificial intelligence identify KPIs to adopt and strategize.
- Problem detection: Let’s face it— human mistakes are unavoidable. Data analytics and AI, though, have much less room for error, and can catch issues otherwise unseen.
- Keeps decision-makers informed: Using thorough data, BI reports help execs, leaders, and sales reps alike make educated decisions about processes or next steps in sales.
The list doesn’t end here; business intelligence tools have almost limitless possibilities according to each team’s needs and the tool’s specifics.
Common BI reporting challenges
Despite increasing investment in big data and AI, and despite more and more companies incorporating business intelligence, many are still failing in their efforts to become data-driven, according to a 2019 study by Harvard Business Review.
While the benefit of business intelligence reporting is undeniable, some common challenges can prevent the data from being used efficiently, such as:
- Not having a sufficient or sufficiently trained data science team,
- Lack of universal adoption of the data tool initiative across departments,
- Letting data become siloed within the tools; in other words, when it becomes limited to certain stakeholders, none of whom see a picture of what’s happening across the organization,
- Inconsistencies across platforms that make it difficult to create accurate dashboards or access all of the information, or;
- Manual data entry being necessitated due to the above issues, which sort of negates some of the conveniences of automation, right?
- Data quality issues: Poor data hygiene leads to inaccurate insights and lost confidence in BI systems
- Integration complexity: Connecting multiple data sources often requires significant technical expertise
- User training and adoption: Teams need proper training to effectively use BI tools and interpret data
- Data governance: Lack of clear policies around data access, security, and compliance
It’s important for cooperating teams to work out these kinks together to ensure smooth sailing.
Examples and Use Cases of Business Intelligence Reporting
Wow, that’s a lot of advantages and challenges to weigh! It would probably be easier to visualize the direct effects of BI with some business intelligence reports examples. It’s time to take a look at the specific functions these programs have to offer. Yet please remember that not all programs will be able to accomplish all of these things!
Real-World Scenario: “As a Sales Operations Director at a mid-market SaaS company, I needed visibility into our 90-day pipeline. Our BI dashboard now shows me which deals are at risk, which reps need coaching, and where to focus our resources for maximum impact.” – Sarah M., Sales Operations Director
Cross-platform integration:
BI tools with cross-platform integration can find, record, and report data from other applications. This way sales reps don’t have to constantly interrupt their workflow to switch between programs to find or compare data. In this way the embedded BI tool allows people to find insights and make decisions faster.
Cross-device access:
Data can be accessed anywhere: on the go via a smartphone, during a meeting with stakeholders, or from home on a laptop. Information can be shared even when offline and will be synced later on. With competitive sales environments, users need to have important information at their fingertips anywhere, anytime, or anyplace.
Dashboards:
Good business intelligence reporting should incorporate dashboards, which are interactive data visualization tools that sort information to make it easier to understand and collaborate. Dashboards also track key performance indicators to help correctly assess which processes are working — or which aren’t.
Data analytics:
While some platforms may just focus on data collecting and organizing, others take it a step further by analyzing this data with artificial intelligence. Machine learning takes sales a step beyond human intuition to automate tasks or even suggest the next best action to move a deal further.
Static reporting and alerts:
These are important ways for users to stay on top of their pipeline and, when necessary, act swiftly. Alerts specific to a team or organization’s needs can be set up based on real-time data. Stakeholders can also easily create and share static reports in common document formats.
Step-by-Step Guide to Creating a BI Report
Follow these steps to create effective BI reports that drive action:
- Define objectives: Clearly identify what business questions you need to answer
- Gather data sources: Identify all relevant data sources (CRM, marketing automation, financial systems)
- Connect and clean data: Integrate data sources and ensure data quality
- Design visualizations: Create charts, graphs, and dashboards that tell a clear story
- Test and validate: Verify accuracy and get feedback from stakeholders
- Share and distribute: Set up automated distribution and access controls
- Monitor and iterate: Continuously improve based on user feedback and changing needs
Best practices: How to achieve a good BI report
With the right tools, a good BI report can be achieved with these factors in play:
- Choose the right KPIs: Focus on metrics that directly impact revenue and business outcomes
- Design intuitive dashboards: Use clear visualizations and logical layouts that tell a story
- Ensure data accuracy: Implement validation rules and regular data quality checks
- Involve stakeholders: Get input from end users during design and testing phases
- Enable continuous improvement: Regularly review and update reports based on changing business needs
- Constant data monitoring
- Defining stakeholders of the report
- Willingness to learn and adapt
- Establishing a data-driven culture across the organization
How to Choose the Best Business Intelligence Reporting Tool
Armed with all this knowledge, it’s time to choose a weapon in your fight for data efficiency! Well, a business intelligence platform, at least.
Every business has its own specific needs, so consider a few questions while selecting a product.
| Feature | Why It Matters | What to Look For |
| Integration Capabilities | Seamless data flow from existing tools | Native CRM integration, API connectivity |
| Ease of Use | User adoption and self-service analytics | Drag-and-drop interface, intuitive design |
| Scalability | Grows with your business | Cloud-based, flexible pricing tiers |
| Visualization Options | Clear communication of insights | Multiple chart types, custom dashboards |
| Security & Compliance | Protect sensitive business data | Role-based access, encryption, certifications |
| Support & Training | Successful implementation and adoption | 24/7 support, training resources, community |
Use this feature comparison to evaluate BI tools against your specific business requirements and technical constraints.
- Does it integrate well with other tools already in play that will continue to be used?
- Does it use and can it be accessed by multiple sources?
- Is it self service? In other words, can it be used without always needing data team management?
- Can data storage like the cloud warehouse in use accommodate the new data solution?
- Is it easy to create ad hoc reports and analyses for those who aren’t data science experts?
For anyone not sure of where exactly their data needs start and end, it might be a good idea to try an all-encompassing business intelligence software that boasts all the necessary basics laid out above.
Why Revenue Grid? Unlike generic BI tools, Revenue Grid is purpose-built for revenue teams, offering native Salesforce integration, automated activity capture from email and calendar, and AI-powered forecasting—so you get actionable insights where sales actually happens.
- Direct Salesforce & inbox integration — No manual data entry, ever.
- Real-time dashboards — Actionable recommendations for pipeline growth.
- Proven results: Customers report 25% faster sales cycles after adopting Revenue Grid (see case study).
Ready to implement BI reporting for your revenue team? Book a demo to see how Revenue Grid can accelerate your sales performance with purpose-built BI capabilities.
What are the 5 stages of business intelligence?
The five stages of business intelligence are: 1) Data sourcing and collection, 2) Data integration and storage, 3) Data analysis and processing, 4) Data visualization and reporting, and 5) Decision-making and action. Each stage builds upon the previous one to transform raw data into actionable business insights.
How do you create a business intelligence report?
To create a BI report: define your objectives and KPIs, gather data from relevant sources, clean and integrate the data, choose appropriate visualizations, design your dashboard or report layout, test for accuracy, and distribute to stakeholders. Follow our step-by-step guide above for detailed instructions.
What are the 4 components of business intelligence?
The four core components of business intelligence are: 1) Data warehousing (storage and organization), 2) Data mining (pattern discovery), 3) Reporting and querying (information presentation), and 4) Analytics (statistical analysis and insights). These components work together to provide comprehensive business intelligence capabilities.