
Key Takeaway
- Lead prioritization ranks prospects by conversion probability using five criteria: ICP fit, problem relevance, buying signals, engagement signals, and deal potential.
- Businesses using predictive lead scoring see an average ROI of 138%, according to Salesforce.
- Only 5% of B2B buyers are in-market at any given time. 95% of unscored outbound effort targets accounts that will not convert this quarter.
- Revenue Grid automates engagement tracking, deal scoring, and CRM data capture, eliminating the manual logging that causes most prioritization systems to fail.
- A lead scoring model that is 60% accurate still outperforms unstructured prospecting because it forces consistent effort allocation.
A practical guide for outbound sales reps who want to focus on the deals most likely to close.
What Is Lead Prioritization (And Why Most Reps Get It Wrong)?
Lead prioritization is the process of ranking sales prospects by their likelihood to convert, so you spend the most time on the leads most likely to close.
Simple concept. Almost nobody does it well.
Here’s why: New salespeople think every lead deserves equal attention. It feels fair and thorough.
However, the reality is brutal: 79% of new leads never convert. Only 5% of B2B buyers are actively in-market at any given time and the average B2B buying cycle spans 11.5 months.
So when you treat 100 leads equally, you’re giving the same energy to the 5 who might buy this quarter as the 95 who won’t.
Top performers flip this. They treat sales like probability management, allocating effort based on signal strength. The result: the same leads can produce dramatically different outcomes depending on prioritization. Teams that focus on high-intent accounts often generate more pipeline because sales reps have limited selling time, typically only about 28–30% of their week is spent actually selling, with the rest consumed by administrative tasks and internal work.
Why Lead Prioritization Separates Top Performers from Average Reps
The Real Cost of Treating Every Lead Equally
Salesforce’s State of Sales report found that reps spend only 30% of their time actually selling. The rest disappears into CRM updates, admin work, and critically chasing prospects who were never going to buy.
Think about that. If you work a 50-hour week, only 15 hours go toward revenue-generating activities. Now imagine spending half of those 15 hours on the wrong accounts.
That’s not a time management problem. That’s a targeting problem.’
How Lead Prioritization Impacts Pipeline Velocity
Here’s a scenario most outbound reps will recognize:
| Approach | Leads Worked | Effort Distribution | Deals Closed |
| No prioritization | 100 | Equal across all | 2–3 |
| Signal-based prioritization | 100 | 70% on top 20 leads | 5–7 |
Same leads. Same rep. Same product. The only variable is where attention goes.
When you prioritize correctly, three things compound: your reply rates increase (because messaging is more relevant), your cycle times shrink (because you’re reaching buyers at the right moment), and your win rates climb (because you’re spending research time on accounts that justify it).
Companies using predictive lead prioritization typically see an average ROI of 138%, according to Salesforce. Not because the tool is magic, but because reps stop wasting time on low-probability accounts.
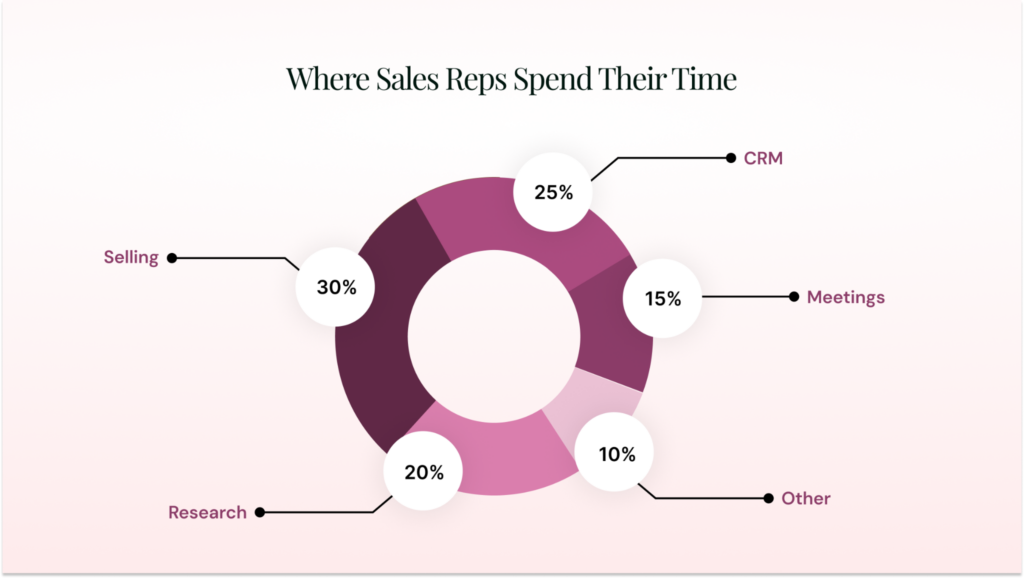
Where sales reps spend their time across selling, CRM work, research, meetings, and other activities.
A Simple Framework Sales Teams Use to Prioritize Outbound Leads
High-performing outbound teams rarely rely on a single scoring method. Instead, they combine firmographic fit, behavioral signals, and engagement data to prioritize accounts, because modern B2B buying processes are complex and often involve multiple stakeholders and long evaluation cycles averaging around 11 months.
Layer 1: Start with ICP Fit
Before you score a single lead, define your Ideal Customer Profile from closed-won data using these five questions:
- Which industries generate the highest close rates?
- What company size closes fastest?
- Which regions or markets buy most often?
- What technology stack aligns with your product?
- Where is the problem your product solves most intensely?
| ICP Factor | High Priority | Medium | Low |
| Industry | SaaS | Fintech | Agencies |
| Company Size | 50–500 employees | 500–2,000 | Under 50 |
| Region | US / EU | APAC | Others |
| Tech Stack | Uses Salesforce | HubSpot | Unknown |
This single filter eliminates 60–70% of bad leads immediately. Most reps skip it entirely and wonder why their pipeline is full of accounts that never close.
Layer 2: Identify Problem Relevance
ICP fit tells you the company could buy. Problem relevance tells you they need to.
A company can match your ICP perfectly: right size, right industry, right tech stack, but if they don’t feel the pain your product solves, they’re not buying anytime soon.
For a revenue intelligence platform, problem signals might include: a scaling sales team with no pipeline visibility, inconsistent forecasting, reps complaining about CRM data quality, or leadership publicly discussing revenue operations challenges.
| Lead | ICP Fit | Problem Signal | Real Priority |
| VP Sales at wrong industry | Weak | None | Low |
| Manager at perfect ICP company | Strong | Scaling pain | High |
| Founder at early-stage startup | Medium | Unclear | Medium |
Sometimes the manager at the perfect company is a better entry point than the VP at the wrong one. Titles alone should never determine priority.
Layer 3: Look for Buying Signals
This is where timing enters the equation. And timing matters more than almost anything else in outbound.
Buying signals indicate a company is likely evaluating new tools right now. The strongest signals, ranked by reliability:
| Signal | Why It Matters | Strength |
| New leadership hire | Leaders evaluate tools within 90 days | Very strong |
| Funding announcement | New budget unlocks purchases | Very strong |
| Rapid hiring in relevant dept | Growing teams need scalable systems | Strong |
| Using a competitor tool | They understand the problem | Strong |
| Organizational changes | Structural changes trigger reviews | Medium |
| Public pain signals | Direct evidence of felt need | Medium |
Here’s the key insight most reps miss: a mediocre ICP-fit company showing strong buying signals will often convert faster than a perfect ICP company showing none.
Key Buyer Intent Signals That Indicate a Prospect Is Ready to Buy

Understanding buyer intent signals is what separates random prospecting from targeted outbound.

Company-Level Signals
- Funding raised within the last 6 months (new budget available)
- New VP or C-suite hire in a relevant department (tool evaluation within 90 days)
- Aggressive hiring in sales, marketing, or ops roles (scaling pains incoming)
- Expansion to new markets or geographies (new operational complexity)
- Job descriptions mentioning your product category or competitor names

Behavioral Signals
- Multiple email opens on your outreach (sustained attention)
- Pricing page visits on your website
- Content downloads (whitepapers, guides, case studies)
- Internal email forwarding (multiple stakeholders evaluating)

Negative Signals (Deprioritize)
- Recent tool purchase in your category (locked in for 12+ months)
- Layoffs or hiring freeze (budget constraints)
- Company in acquisition or restructuring (decisions frozen)
- Contact left the company (your champion is gone)

Revenue Grid's Revenue Signals feature automatically monitors many of these behavioral signals and alerts reps when high-priority accounts show increased activity.
Layer 4: Track Engagement Signals
Engagement signals show which prospects are actually paying attention to your outreach. This is the difference between hoping a lead is interested and knowing it.
Examples include:
| Engagement Signal | What It Indicates |
| Multiple email opens | Prospect is reviewing the message repeatedly |
| Link clicks | Interest in a specific resource or offer |
| Meeting responses | Prospect is considering a conversation |
| Content downloads | Active research about the problem |
| Website visits | Interest in product or solution |
| Internal email forwarding | Multiple stakeholders evaluating |
The problem is that tracking engagement manually is nearly impossible at scale. You’d need to check email analytics, CRM activity logs, website visitor data, and social engagement across every lead, every day.
This is where revenue intelligence platforms like Revenue Grid become essential. They automatically capture engagement signals across email, calendar, and CRM, then surface the prospects showing the highest activity
Layer 5: Assess Deal Potential
Not all deals justify the same effort. A $50,000 annual contract deserves significantly more research time than a $2,000 deal.
| Company | ICP | Signals | Engagement | Deal Size | Priority |
| Enterprise SaaS | Strong | New VP Sales | 5 email opens | ~$50K ARR | Tier 1 |
| Mid-market fintech | Strong | Hiring SDRs | 2 email opens | ~$25K ARR | Tier 2 |
| Small agency | Weak | None | 1 email open | ~$3K ARR | Tier 3 |
Also consider strategic value. Some logos, even at lower deal sizes, open doors to an entire market segment.
How to Prioritize High-Value Leads in Outbound Sales
To prioritize high-value leads, you need to build a lead scoring system.
Here’s a practical lead scoring model you can build in under an hour.
Step 1: Define Your ICP from Closed-Won Data
Pull your last 20–30 closed deals. Look for patterns: What industries appeared most? What company size range dominated? What job titles signed the contract? What problems did they mention in discovery calls?
This gives you an evidence-based ICP.
Step 2: Map the Signals That Predict Conversion
| Signal | Points |
| Company matches ICP | +30 |
| Correct buying role (VP, Director, Head of) | +20 |
| Recently raised funding | +10 |
| Hiring in related roles | +10 |
| Uses competitor tools | +10 |
| Engaged with content or emails | +10 |
| Warm intro or referral | +10 |
Step 3: Set Thresholds and Prioritize
| Score Range | Priority | Action |
| 80–100 | Hot | Call immediately. Deep personalization. |
| 60–79 | High | Semi-personalized outreach within 48 hours |
| 40–59 | Nurture | Add to targeted email sequence |
| Below 40 | Low | Automated sequence or defer |
The magic isn’t in the specific point values. It’s that you now have a system instead of a guess. Even if your scoring model is only 60% accurate, it still dramatically outperforms intuition, because it forces consistency.
Step 4: Automate Data Capture
A scoring model is only as good as the data feeding it. If reps have to manually log every interaction, the data will be incomplete, and the model breaks.
Revenue Grid solves this by automatically syncing all email opens, link clicks, meeting activity, and call data to Salesforce. Reps don’t log anything manually; the CRM stays current, and the scoring model has complete, accurate data to work from.
Step 5: Test, Validate, and Iterate Monthly
Your first scoring model won’t be perfect. That’s fine. Review it monthly: Are high-scoring leads actually converting at higher rates? Adjust point values based on real conversion data.
The best sales teams treat their scoring model like a product — shipping improvements continuously based on what the data shows.
Example: How Lead Prioritization Works in Practice
Let’s walk through a realistic scenario so you can see exactly how this plays out in a rep’s day.
You’re an outbound SDR selling a SaaS product. Your target market is SaaS companies with 50–500 employees. You’ve added five leads to your CRM and sent outreach emails to all five.
Scenario 1: Manual Prioritization
Without any tracking system, you’re flying blind. You sent five emails, maybe someone opened one, maybe someone forwarded it to their team, maybe all five ignored it. You don’t know.
So you follow up randomly. You might chase Omega Labs because their name sticks in your head, while FinFlow, who opened your email four times and forwarded it internally, sits untouched.
This is how warm leads die — from bad prioritization.
Scenario 2: Prioritization with Revenue Intelligence Platform
Revenue Intelligence platforms like Revenue Grid automatically track every interaction and sync it to your CRM without manual logging. One week later, your dashboard shows:
| Lead | Email Opens | Other Signals | Priority |
| FinFlow (Sarah) | 5 opens | Forwarded internally | Very High |
| CloudDesk (Mark) | 3 opens | Clicked pricing link | High |
| ScaleAI (David) | 1 open | No additional activity | Medium |
| ZenMetrics (Emma) | 0 opens | No activity | Low |
| Omega Labs (Alex) | 0 opens | No activity | Low |
Now your morning is clear. Call FinFlow immediately, five opens plus internal forwarding means multiple people are evaluating. Send CloudDesk a case study. Follow up with ScaleAI using a different angle. Add ZenMetrics and Omega Labs to nurture sequences.
The difference isn’t just visibility; it’s speed.
The 10-10-10 Daily Outbound System
Even with perfect prioritization, outbound only works with consistency. The 10-10-10 rule creates a daily rhythm:
- Research 10 new accounts
Identify companies that match your ICP and assign preliminary scores. - Send 10 personalized messages
Focus on Tier 1 and Tier 2 leads with relevant messaging. - Follow up with 10 engaged prospects
Prioritize prospects who opened emails, clicked links, or visited your website.
That’s 30 prospect touches per day, 150 per week. Even with modest conversion rates (8–12% reply rate, 2–5% meeting rate), you’re building a strong pipeline.
Where Revenue Grid accelerates this: instead of starting each morning by manually scanning your inbox for engagement updates, you open a dashboard showing exactly which prospects showed activity overnight. Your follow-up block becomes surgical instead of scattered.
5 Lead Prioritization Mistakes That Quietly Kill Results
1. Treating All Leads Equally
The 60-30-10 effort allocation framework fixes this:
- Spend 60% of manual follow-up effort on Tier 1 leads: personalized calls, tailored emails, custom resources.
- 30% on Tier 2 leads: semi-personalized sequences with relevant case studies.
- 10% on Tier 3 leads: fully automated nurture. No manual time.
| Touchpoint | Day | Action |
| 1 | Day 1 | Personalized email referencing a specific buying signal |
| 2 | Day 3 | Follow-up with different angle or resource |
| 3 | Day 7 | Case study aligned to their industry |
| 4 | Day 12 | Breakup email with clear final ask |
2. Scoring by Job Title Alone
A VP at the wrong company is a worse lead than a Manager at the perfect ICP company with active buying signals. Titles indicate authority, not intent.
3. Ignoring Engagement Signals
When someone opens your email five times, that’s rarely accidental. This is arguably the strongest case for revenue intelligence: not that it generates leads, but that it makes existing engagement visible.
4. Following Up Randomly
Most deals require 3–5 touches. Without a system, follow-ups happen based on whoever the rep remembers, not whoever showed the most sales engagement.
| Touchpoint | Timing | Action |
| 1 | Day 1 | Personalized email |
| 2 | Day 3 | Follow-up (new angle) |
| 3 | Day 7 | Share relevant case study |
| 4 | Day 12 | Breakup email |
5. Over-Researching Low-Value Accounts
Spend no more than 10 minutes researching any account before sending outreach. If the account doesn’t justify 10 minutes of research, it doesn’t justify personalized outreach at all.
Where Revenue Grid Simplifies the Sales Workflow
Everything in this guide works without software. But manual systems break. Reps stop logging; CRM data goes stale, and engagement signals get missed.
Revenue Grid acts as an intelligence layer on top of your CRM, specifically designed to eliminate the friction that kills lead prioritization in the real world.
Automatic Activity Capture
Every email, meeting, call, and interaction syncs to your CRM automatically. Reps never log activities manually. Many sales reps spend 60–65% of their time on administrative tasks instead of selling. Automatic activity capture reclaims a significant chunk of that time.
Real-Time Engagement Insights
Revenue Grid surfaces which prospects are showing buying behavior right now. Instead of checking five different tools each morning, reps see a single prioritized view of their most active opportunities.
AI-Powered Deal Scoring
Beyond rule-based scoring, Revenue Grid uses AI to analyze deal health and progression patterns. It can flag when a previously hot deal is losing momentum, before the rep notices.
Deal Risk Alerts
If a prospect goes silent for 10+ days, or a deal stalls at a specific pipeline stage, the system alerts the rep. This prevents warm opportunities from going cold.
Guided Next Actions
The system recommends specific actions: send a follow-up, schedule a demo, involve a decision-maker. Especially valuable for newer reps who haven’t yet developed experienced pattern recognition.
The Mindset Shift
Here’s the uncomfortable truth that experienced sales reps know but rarely say out loud:
Most outbound success doesn’t come from better messaging. It doesn’t come from a clever subject line or a perfect cold call script. 80% of outbound success comes from targeting the right accounts at the right time.
Modern B2B buyers complete a significant portion of their research independently before contacting vendors, meaning sales teams must identify accounts already showing intent signals rather than relying solely on persuasive outreach.
Outbound success = Account Selection × Timing × Consistency.
When your sales teams combine structured prioritization with Revenue Grid, they gain visibility into the signals that matter: engagement patterns, deal momentum, and pipeline risk, and can allocate their limited selling time to the opportunities most likely to close.
That’s a fundamentally different way of working. And once you see it, you can’t go back to treating all sales leads equally.
Book a demo to experience it yourself.
What is the difference between lead scoring and lead qualification?
Lead scoring assigns numerical values to prospects based on fit and behavior signals — it’s a ranking system. Lead qualification is the process of confirming whether a specific lead meets the criteria to become a sales opportunity through direct conversation. Scoring happens before outreach; qualification happens during it. Frameworks like BANT and MEDDIC are qualification methodologies, while point-based models are prioritization tools.
How many scoring signals should you start with?
Start with 5–7 signals. Begin with: ICP fit, buying role, one or two timing signals (funding, new hire), and one engagement signal (email opens). You can add more as you gather conversion data.
Can small teams score leads without expensive tools?
Yes. A spreadsheet with 5 columns (ICP fit, role match, timing signal, engagement, deal size) and a simple 1–5 rating per column gives you a working system. The limitation is manual data entry, which is where Revenue Grid becomes valuable as the team scales.
How often should you recalibrate your lead scoring model?
Monthly. Pull conversion data, compare predicted priority against actual outcomes, and adjust weights. Most teams find that after 2–3 iterations, their model starts reliably predicting which accounts are worth pursuing.
How do you prioritize inbound versus outbound leads differently?
Inbound leads start at a higher baseline score because they’ve already shown intent. Outbound leads require you to identify intent through external signals. The frameworks overlap, but inbound weights behavioral signals more heavily, while outbound weights ICP fit and timing signals.