

Key Takeaway
- AI sales forecasting uses machine learning to analyze pipeline data, engagement signals, and historical outcomes, producing predictions that continuously improve as deals close or are lost.
- Most forecasting failures are data problems, not AI problems. 76% of CRM entries are less than half complete, which distorts every model built on top of them.
- Architecture matters: tools that write activity data natively inside Salesforce consistently outperform tools that sync externally or store data on AWS.
- Only 7% of sales organizations achieve 90%+ forecast accuracy. The path runs through automated activity capture, explainable AI signals, and consistent process.
- Revenue Grid is a Salesforce-native platform that captures activity data directly into Salesforce objects, provides AI-driven deal scoring through Revenue Signals, and delivers documented outcomes including 96% forecast accuracy.
What Is AI Sales Forecasting and Why Is Everyone Talking About It Now?
AI sales forecasting is the use of machine learning to analyze historical deal outcomes, real-time pipeline activity, and engagement signals to predict future revenue. Unlike traditional methods built on rep intuition or weighted-stage probabilities, AI models retrain continuously on new data, scoring each deal on two dimensions: the probability it closes and the predicted close date.
The promise is real, but so is the gap. Gartner research (May 2025) puts median forecast accuracy at 70–79% across organizations that have already adopted AI forecasting tools. Only 7% hit 90% or above. That number is the central problem this guide addresses: not what AI forecasting is, but why it still underdelivers for most teams.
If AI Is So Smart, Why Do Most Sales Forecasts Still Miss?
The answer is not the algorithm. It is everything feeding into it.
Reps carry optimism bias. They set close dates based on when they want the deal to land, not when the buyer’s procurement process will actually complete. Managers apply their own correction on top, usually overcorrecting in the opposite direction. By the time the number reaches the VP, it has passed through three layers of subjective judgment with no objective signal data underneath it.
That is not a soft problem. Xactly’s 2024 State of Sales Forecasting Benchmark Report found that fewer than 25% of sales organizations forecast within 10% of actual results. When a forecast misses, the cascade is immediate: hiring plans freeze, marketing budgets get cut mid-quarter, and the CFO loses confidence in the CRO’s projections. For public companies, a guidance correction moves the stock price.
What makes this resolvable is that 97% of sales and finance leaders agree on the cause: better data would make accurate forecasting significantly easier (Xactly, June 2024). The problem is not that people cannot forecast. The problem is that the data they are forecasting from is incomplete.
How Does AI Sales Forecasting Actually Work?
The mechanism matters because it reveals exactly where things break. AI for sales forecasting runs in five sequential steps, each one dependent on the step before it.
- Data ingestion. The system pulls in CRM fields (stage, amount, close date, account metadata), email and calendar activity, call transcripts, and sometimes external signals like hiring announcements. The richer the input, the more accurate the output.
- Signal extraction. The AI identifies behavioral patterns: champion engagement frequency, stakeholder multi-threading, velocity through pipeline stages, sentiment shifts in email threads, and gaps between what the rep reported and what the activity log shows. These signals carry far more predictive weight than the stage a rep dragged a card into.
- Deal scoring. A machine learning sales forecasting model assigns a close probability and predicted close date to each deal, calibrated against the organization’s own historical wins and losses. A deal that mirrors past wins scores higher. One that mirrors past losses gets flagged.
- Roll-up. Individual deal scores aggregate into team, segment, and company-level forecasts. Commit, best case, and worst case scenarios generate automatically. The CRO sees one view; the frontline manager sees another. Both numbers come from the same model.
- Continuous retraining. Every closed-won or closed-lost deal refines the model’s calibration. McKinsey’s 2024 research found these systems reduce forecast errors by 20–50% when fed integrated data from multiple sources. That range is the ceiling the architecture makes possible.
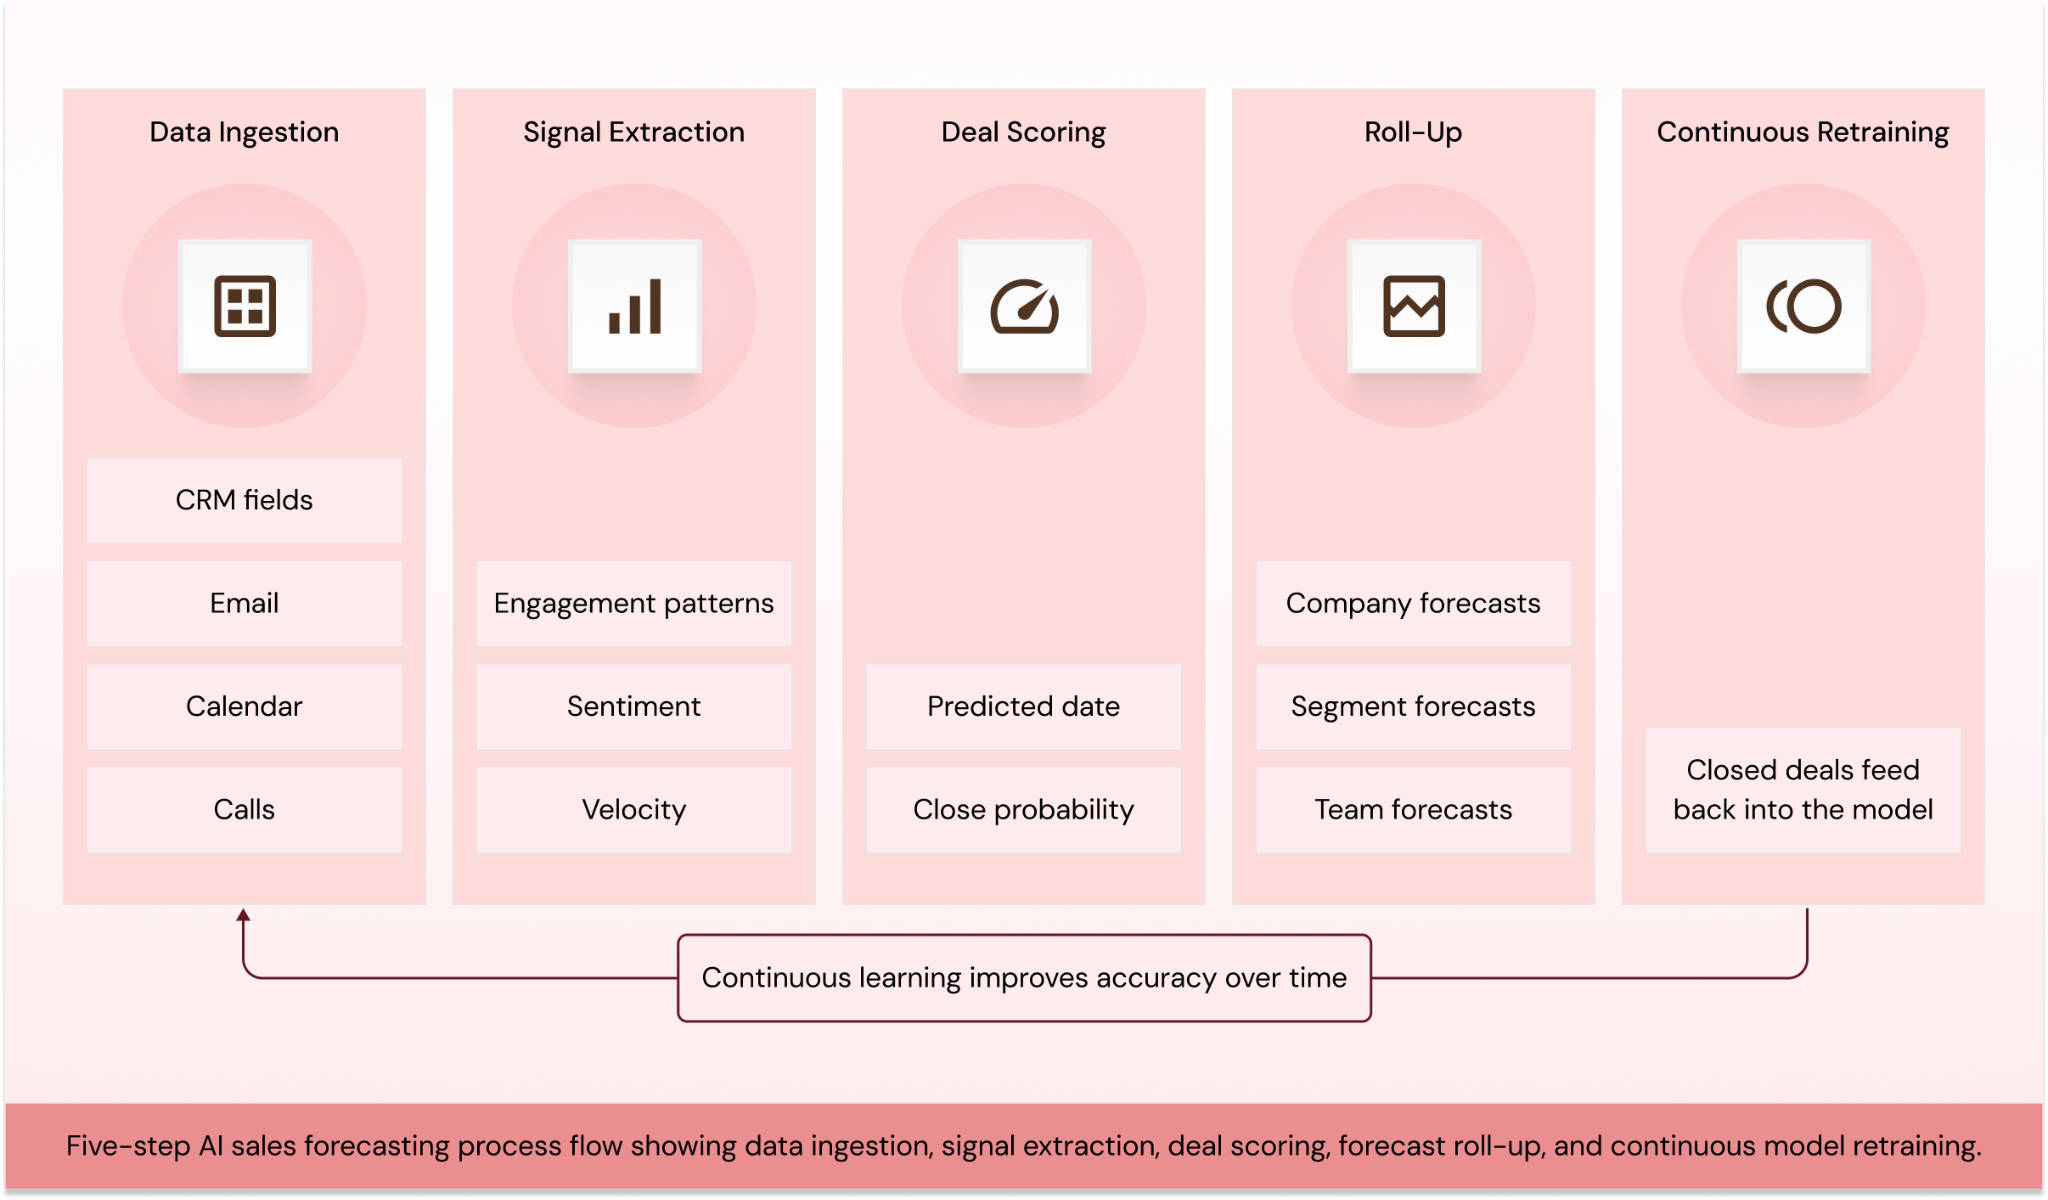
Five-step AI sales forecasting process flow showing data ingestion, signal extraction, deal scoring, forecast roll-up, and continuous model retraining.
Many AI forecasting tools weight deals by stage probability, then label that calculation ‘AI-powered.’ True AI forecasting weights deals by observed behavioral signals, not by the stage a rep manually selected. One is a marginally smarter spreadsheet. The other is a prediction engine. The difference only shows up when you look at what data the model is actually trained on.
The Inconvenient Reality: Your AI Is Only as Good as Your CRM Data
According to CRM hygiene research cited by Landbase (2025–26), 76% of CRM entries are less than 50% complete. Reps skip fields. Meetings go unlogged. Email threads never reach the opportunity record. When an AI model trains on that data, the wrong answers it produces are not a model failure. They are an input failure. The algorithm is doing exactly what it was designed to do; it is just working from an incomplete picture.
Gartner confirmed the pattern at its CSO and Sales Leader Conference in May 2025: the two AI capabilities that most reduce forecasting burden are activity capture and conversation intelligence. The prediction layer is secondary. That ordering has a direct implication for platform evaluation. The architecture of how a tool captures and stores data matters more than the sophistication of its prediction model.
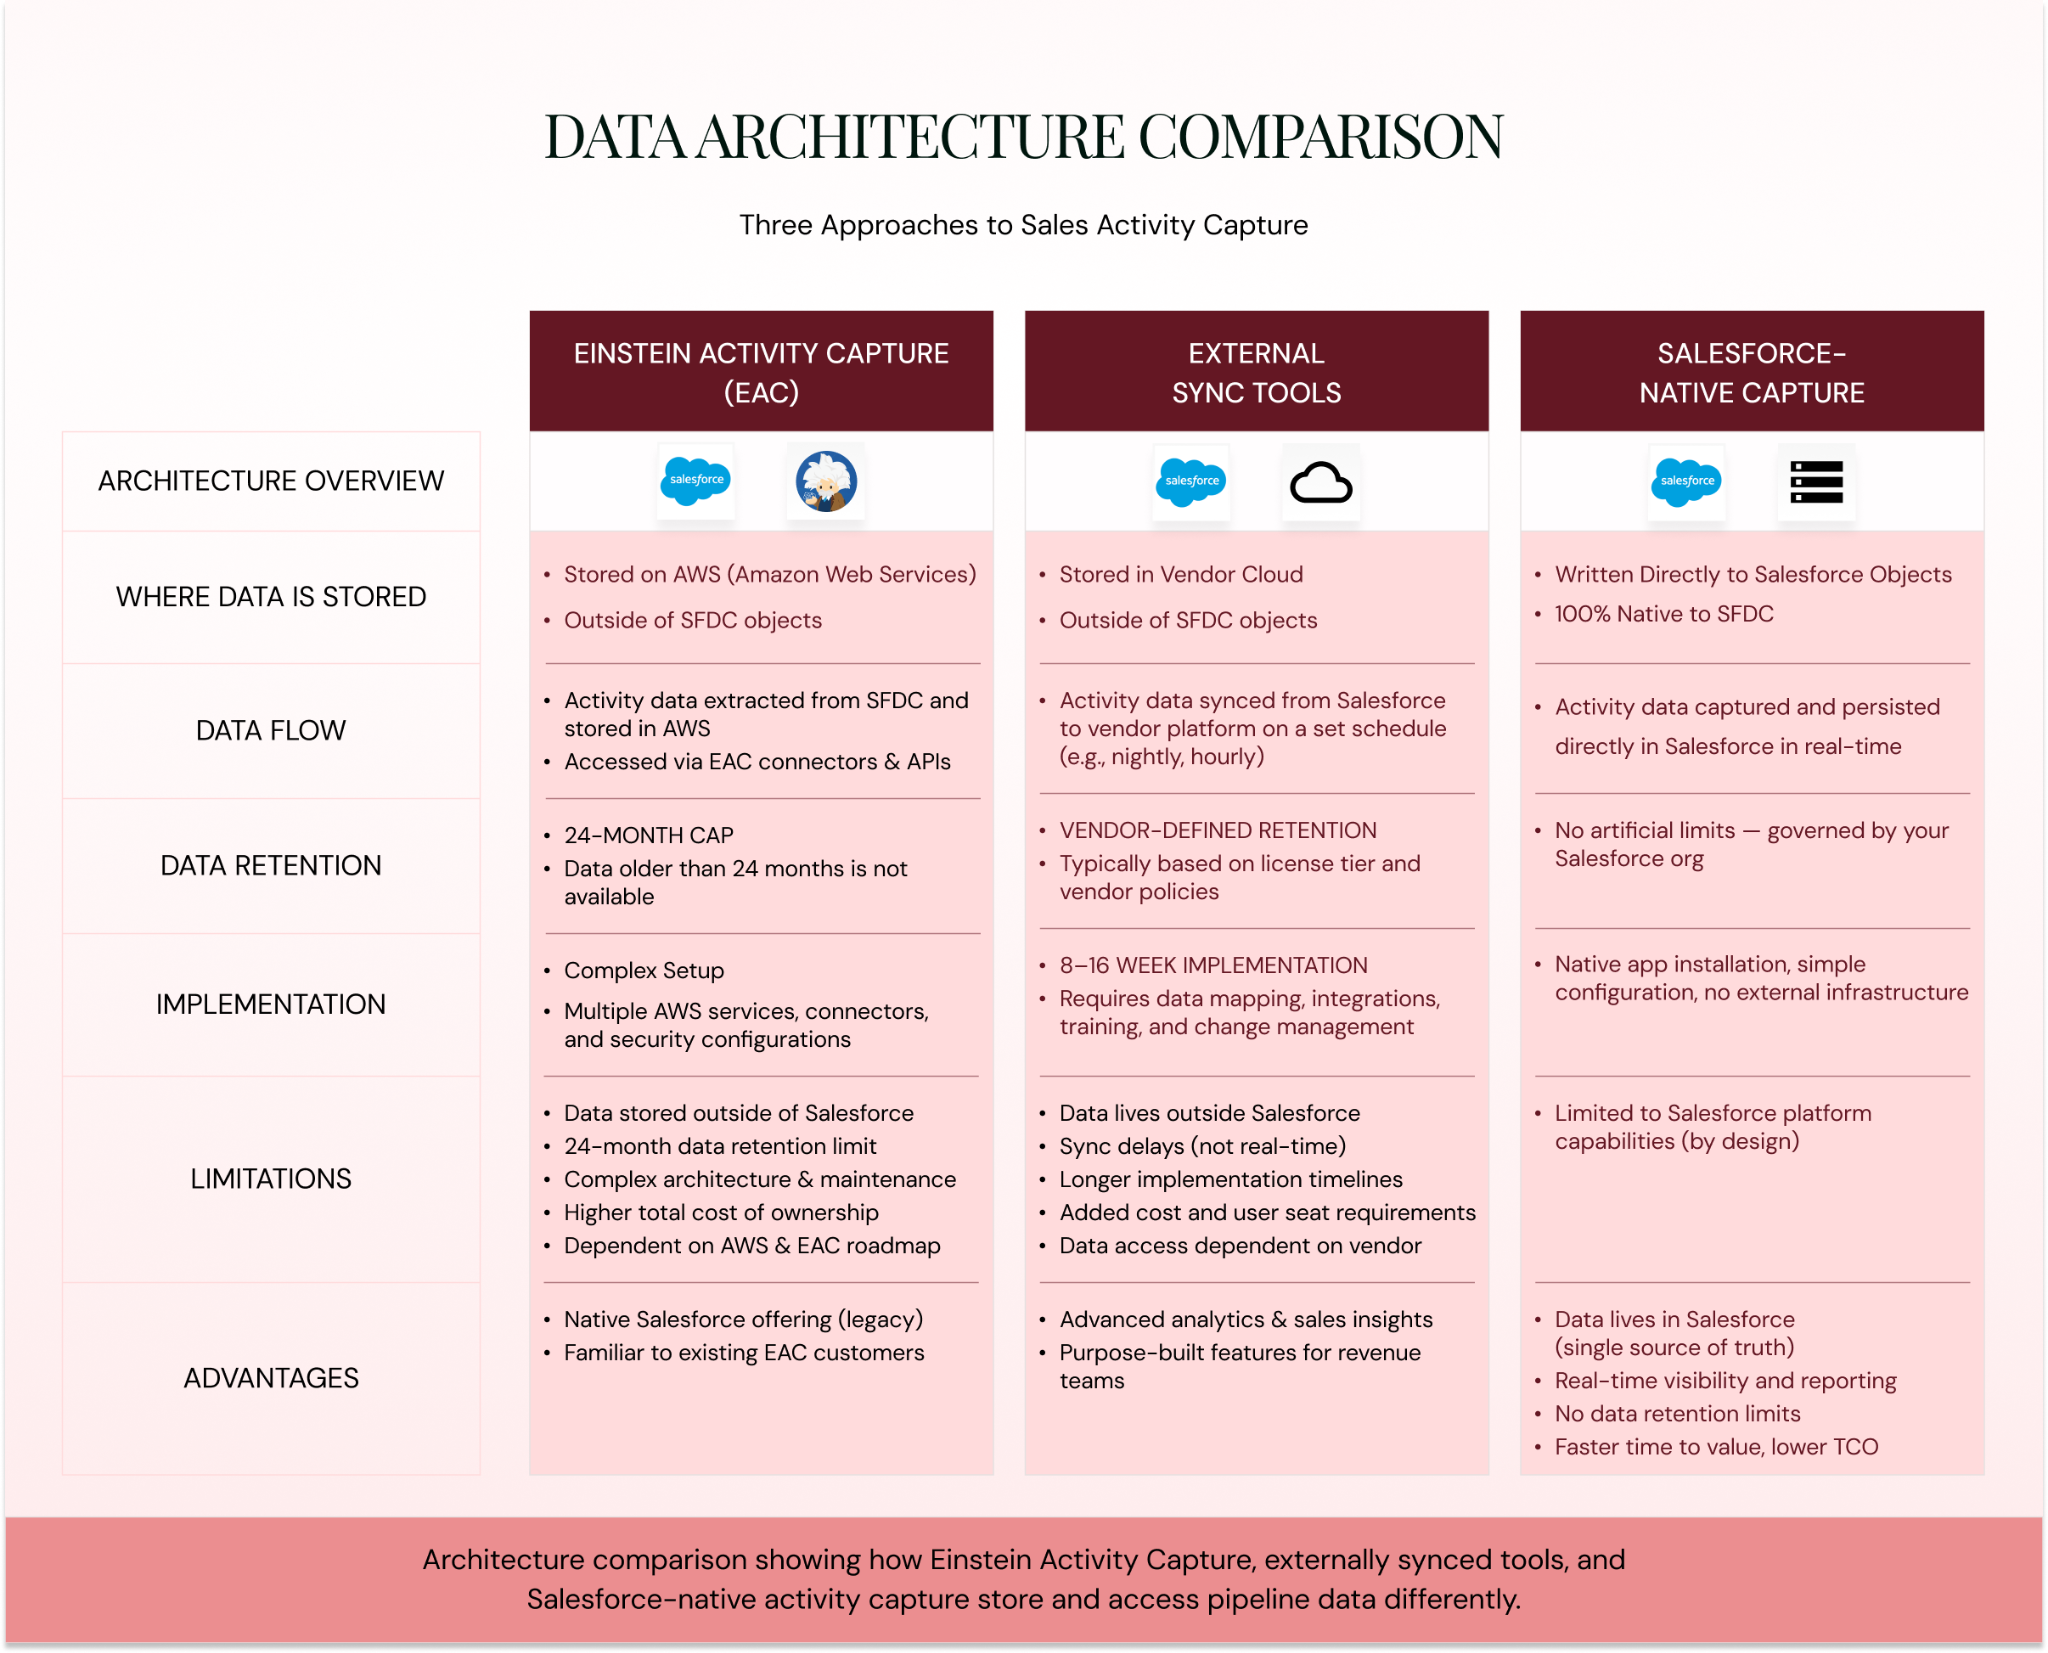
Architecture comparison showing how Einstein Activity Capture, externally synced tools, and Salesforce-native activity capture store and access pipeline data differently.
| Platform Approach | How Data Is Stored | Key Limitation |
|---|---|---|
| Einstein Activity Capture (Salesforce native add-on) | Captured emails and calendar events are stored on AWS outside native Salesforce objects and are not written into standard Salesforce fields. | Limited to 24-month retention, lacks custom-object support, and captured data is unavailable for downstream reporting or AI model training. |
| Externally synced tools (Clari, Gong, Aviso) | Activity and forecasting data are stored in the vendor’s cloud and synchronized with Salesforce through APIs or scheduled sync processes. | Validation rules must be maintained across multiple systems, sync delays can create stale data windows, and implementations commonly require 8–16 weeks plus significant professional services costs. |
| Salesforce-native activity capture (Revenue Grid) | Emails, meetings, and call records are written directly into Salesforce objects as standard CRM records. | No external data store dependency, with indefinite retention and full support for custom objects and shared mailboxes. |
Sources: Revenue Grid product documentation; Salesforce EAC documentation; Maxiq’s 2026 analysis of Clari implementation costs.
The sequence matters. A $200-per-user forecasting tool trained on a CRM with 50% data completeness produces confident predictions built on an incomplete picture. The correct investment order is: (1) automated activity capture writing directly to Salesforce, (2) CRM data hygiene, (3) signal-based deal scoring, (4) predictive forecasting. Reverse that order and the AI amplifies the gap rather than closes it.
One more factor compounds the data problem. A 2024 World Economic Forum analysis found that black-box AI models erode trust because users cannot verify the reasoning behind a score. In forecasting terms: if a rep cannot see why their deal was scored at 35%, they ignore the score entirely. Explainability is not a feature request. It is what determines whether adoption happens at all, and adoption is what keeps the data flowing.
What Should You Actually Look for in an AI Sales Forecasting Tool?
The market is crowded enough that real differences are architectural, not cosmetic. These ten criteria separate tools that deliver forecast accuracy from tools that deliver dashboards.
- Automated activity capture that writes natively to Salesforce records. No AWS staging layer. No external sync. Data should appear as standard Salesforce fields the moment it is captured.
- Signal-based deal scoring with explainability. Every score should show the reasons behind it: stakeholder engagement gaps, response latency, multi-threading depth, sentiment shifts. A number without a reason earns no rep trust.
- Multi-pipeline and multi-segment roll-ups. The tool should roll forecasts up by geography, product line, and business unit without requiring RevOps to build separate reports.
- Forecast audit trail. Every change to a forecast number should log who changed it, when, and why. Without this, a missed forecast cannot be diagnosed.
- AI risk and slippage detection with next-best-action prompts. Red flags with no recommended action are half a tool.
- Conversation and email intelligence tied to deal records. Call insights and email engagement data should connect directly to the opportunity, not sit in a separate system the rep never opens.
- In-CRM workflow. Forecasting, signals, and coaching should live inside Salesforce, Slack, or Teams. Every tool switch reduces adoption.
- Custom-object support, shared mailbox capture, and assistant-calendar support. Enterprise configurations are complex. Tools that only support standard objects miss critical data.
- Indefinite data retention. A 24-month cap limits how much the model can learn from long sales cycles.
- Deployment in days, not quarters. Enterprise platforms commonly require 8–16 weeks with $15K–$75K in professional services (Maxiq, 2026). Salesforce-native alternatives deploy in under a week. Time-to-value belongs in the evaluation, not the afterthought.
What Are the Mistakes That Derail AI Forecasting Implementations?
These eight mistakes appear consistently across G2 reviews, Gartner research, and RevOps community discussions. Most are avoidable once you know to look for them.
- Buying the model before fixing the data. A forecasting tool trained on a CRM with 50% data completeness produces confident predictions built on an incomplete picture. Automated activity capture should come first. The prediction model should come second.
- Treating AI forecasting as a manager tool only. Tools that surface insights for managers without reducing rep workload get low adoption. The rep is the primary data source. When the tool adds friction to their workflow, data quality degrades and the forecast degrades with it.
- Stacking redundant tools without consolidating. Roughly 40% of mid-market Gong customers also run Clari (Oliv.ai, 2026 analysis of 600+ reviews). Multiple overlapping platforms increase cost, create conflicting data sources, and burden RevOps with integration maintenance.
- Underestimating implementation time. Enterprise forecasting platforms commonly require 8 to 16 weeks to deploy, with professional services fees running $15K to $75K. Salesforce-native alternatives deploy in days. The gap in time-to-value should be a primary evaluation criterion.
- Skipping the forecast audit trail. When the forecast misses, the CFO’s first question is: what changed and when? A tool without a timestamped log of every modification makes that question impossible to answer.
- Accepting vendor accuracy claims at face value. Vendor websites routinely cite accuracy figures of 90 to 98%, measured against their own benchmark data, not your pipeline. Any responsible evaluation should include a two-quarter pilot against the organization’s actual results.
- Forgetting governance. AI automates the prediction. It does not automate the organizational discipline around how that prediction is reviewed, escalated, or acted on. Someone still has to own the forecast definition, stage taxonomy, submission cadence, and escalation process.
- Ignoring explainability. If a rep cannot see why the AI scored their deal at 35%, they will not change their behavior. The score becomes noise. Explainable signals, where each score carries a visible rationale, are what turn the AI from a reporting layer into a tool reps actually respond to.
How Does Revenue Grid Solve This for Salesforce Teams?
Revenue Grid was built for the architecture this guide describes. Every layer of the problem maps directly to how the platform works.
The foundation is Salesforce sales forecasting done natively. Every email, meeting, and call is captured and written directly into Salesforce objects. No AWS staging. No external sync. No 24-month retention cap. Custom objects, shared mailboxes, and assistant calendars are fully supported. The result is a Salesforce instance with complete, real-time activity data available for any downstream model, report, or workflow.
On top of that data layer, Revenue Signals provide AI deal risk detection, slippage alerts, and next-best-action recommendations. Each signal is explainable. Reps see exactly why a deal was flagged: a champion went silent for two weeks, a competitor was mentioned in a recent email, a key stakeholder has not been engaged since discovery. Managers see which deals need intervention and what kind is most likely to work.
The AI Sales Assistants extend this into the rep’s daily workflow. The Records Assistant handles CRM hygiene with zero rep input. The Meeting Assistant generates pre-call briefs. The Pipeline Assistant provides deal health commentary. Mentor delivers in-CRM coaching cues. All of it lives inside Salesforce, Slack, and Teams.
For pipeline forecasting, Revenue Grid standardizes submission cadence across reps, managers, and VPs, broken out by geography, product line, and business unit. The audit trail logs every change. Roll-ups are automatic. The CRO opens one dashboard.
The documented outcomes reflect the architecture:
- 96% forecast accuracy across Revenue Grid customers
- 761 working days saved per year at Vapotherm through automated activity capture and pipeline visibility
- 15–20% caseload increase at Morgan & Morgan while simultaneously improving CRM adoption
- 30% contract increase per business unit at an insurance brokerage using Revenue Grid’s guided selling
Defend your forecast with data, not optimism.
See how Salesforce-native AI forecasting works for your pipeline.
How accurate is AI sales forecasting?
AI sales forecasting accuracy sits at a median of 70 to 79% across organizations that have adopted it, with only 7% achieving 90% or above (Gartner, May 2025). Models reduce forecast errors by 20 to 50% when fed clean, integrated data (McKinsey, 2024). The ceiling depends on input data quality more than model sophistication.
What are the best AI tools for sales forecasting?
The leading tools include Revenue Grid (Salesforce-native, full-funnel), Clari (pipeline inspection and forecasting), Gong (conversation intelligence with forecast overlay), Aviso (AI-driven enterprise forecasting), and Outreach (sales engagement with forecasting capabilities). The right choice depends on your CRM environment, team size, implementation timeline, and whether you need activity capture alongside the forecasting module.
Can ChatGPT do sales forecasting?
General-purpose LLMs can generate forecast commentary or analyze exported datasets, but they cannot access live CRM pipelines, track deal signals in real time, or retrain on an organization’s historical outcomes. AI sales forecasting requires continuous integration with Salesforce data, email and calendar systems, and conversation intelligence. Purpose-built platforms like Revenue Grid are built for that.
How does AI improve sales forecasting accuracy?
AI replaces subjective inputs (rep gut-feel, manager bias) with objective signals: email engagement frequency, stakeholder response latency, stage velocity, and sentiment analysis. Models retrain as deals close or are lost, progressively calibrating to the organization’s actual win patterns. The largest accuracy gains come when the AI has access to complete activity data, which is why automated activity capture matters more than the model architecture.