
Key Takeaway
- Most pipeline reviews fail because the data feeding them is self-reported, stale, and optimistic. Structure fixes the meeting. Trustworthy data fixes the forecast.
- This guide includes: a free pipeline review template with a manager view and a rep view, a 7-question framework with the rationale and specific data point behind each question, a time-boxed 30-minute meeting agenda, and seven pipeline health metrics with formulas and benchmarks.
- 76% of B2B sellers missed quota in H1 2025 (Ebsta x Pavilion, 2025 GTM Benchmarks, Gradient Works, March 2026). The data problem behind that number starts with the pipeline review.
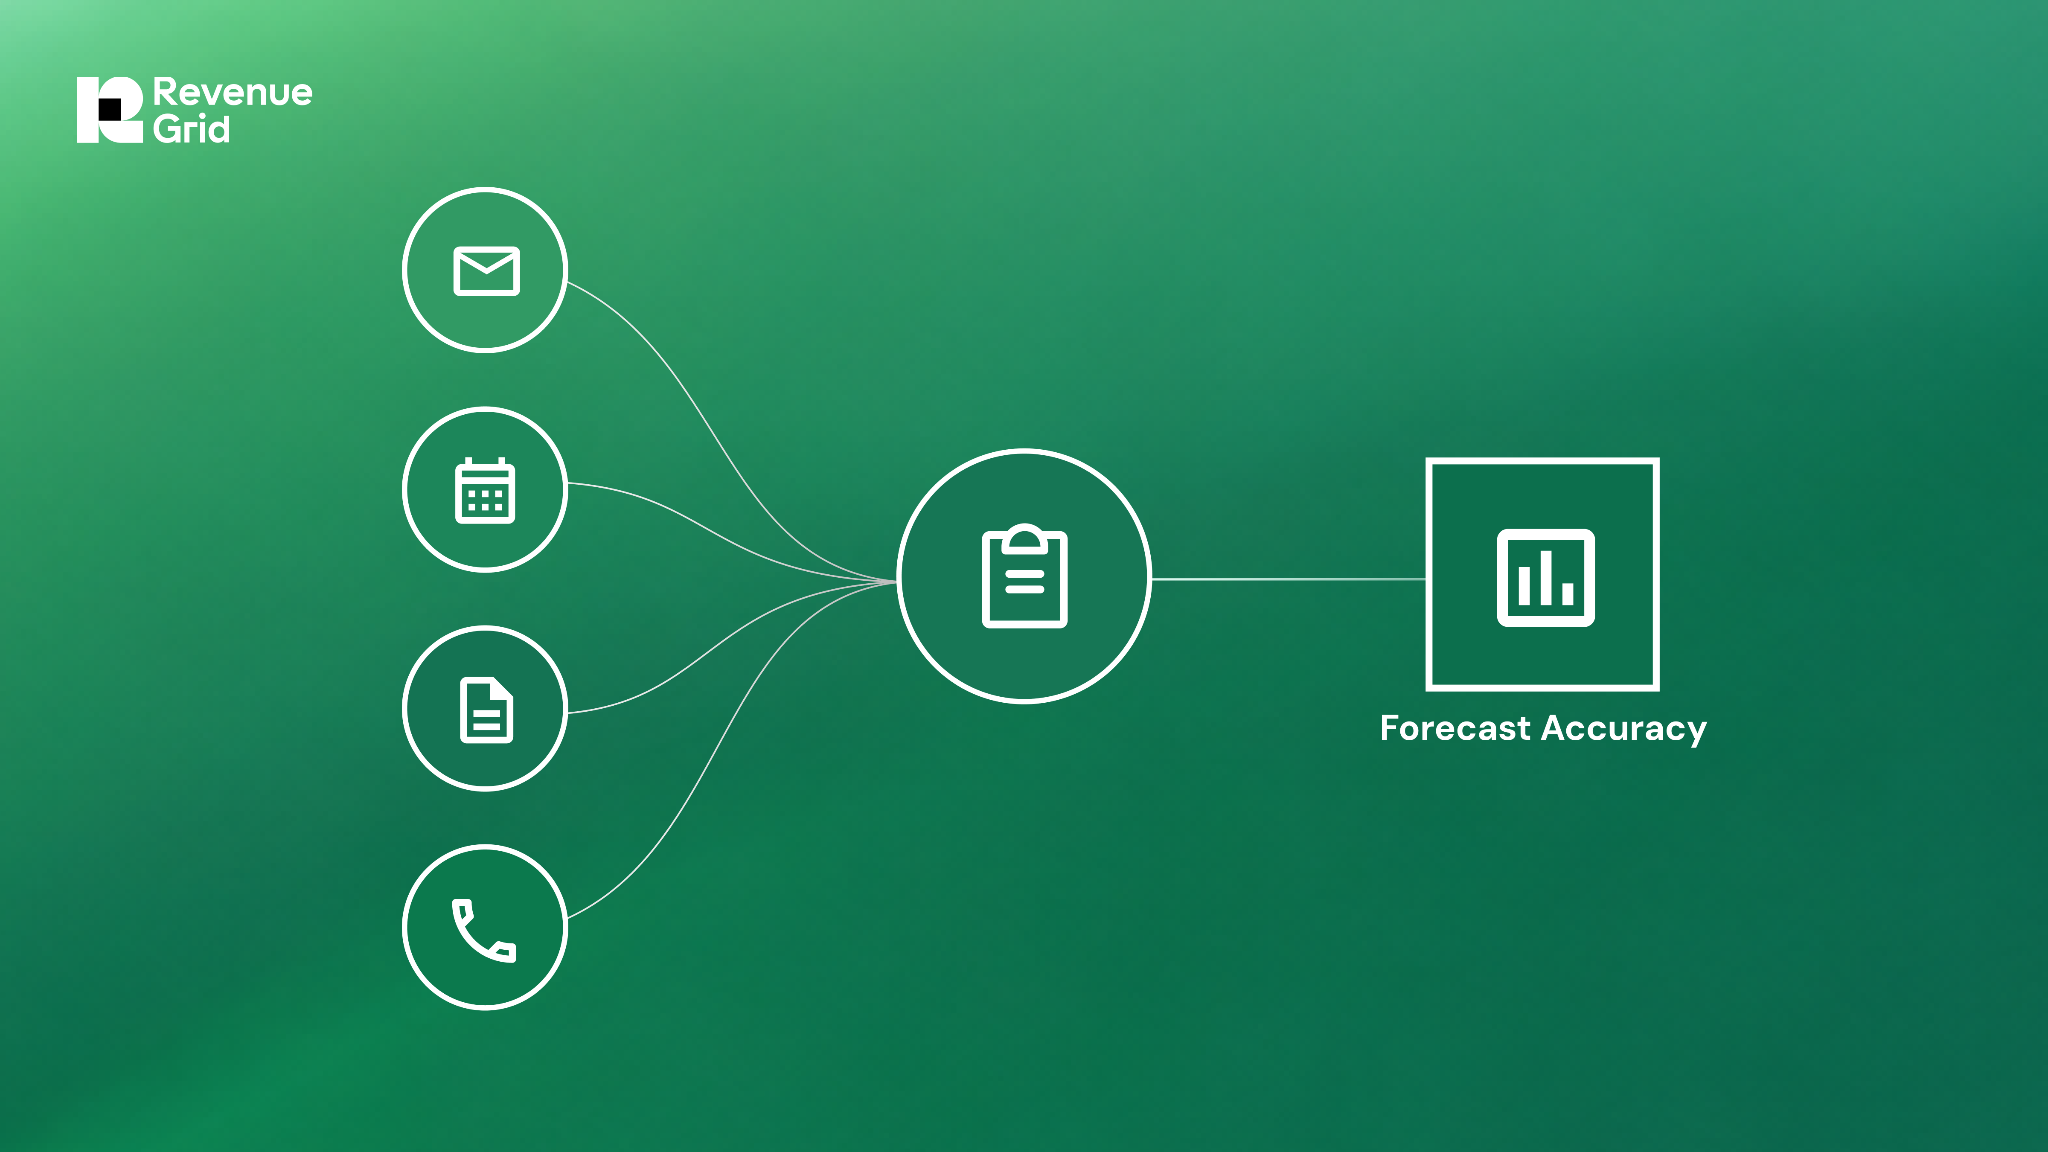
- Revenue Grid's Pipeline Assistant automates the pre-meeting discovery stage, surfacing deal activity, risk signals, and momentum data before anyone opens a calendar invite.
A pipeline review template does one thing: it replaces the unstructured status dump with a repeatable inspection process. Most pipeline reviews are not productive meetings. They are 45-minute sessions where managers read CRM fields aloud, reps scramble to recall deal details, and the only real outcome is a shared sense of anxiety about the quarter. That pattern has a name on r/sales: “busywork so leadership doesn’t have to read CRM updates.” This guide is built to replace it, with a 7-question framework, separate manager and rep views, a time-boxed agenda, and the pipeline health metrics that make reviews predictive rather than reactive.
| The data problem behind missed forecasts
76% of B2B sellers missed quota in H1 2025 (Ebsta x Pavilion, 2025 GTM Benchmarks, Gradient Works, March 2026). Only 7% of companies achieve 90% or higher forecast accuracy (Gartner, via ORM-tech, March 2026). 56% of sales organisations rate their pipeline management as poor or neutral (Prospeo, 2026). Those that get it right see a 15% revenue lift. |
Jump straight to the free pipeline review template below, or work through the full guide to understand why the framework works and how to make your reviews defensible, not just structured.
What Is a Pipeline Review Template?
| Definition: Pipeline Review Template
A pipeline review template is a standardized structure for inspecting deals, surfacing risk, and aligning on next steps during a recurring review meeting. It is not a deal storage tool — that is the CRM’s job. A pipeline review template is the inspection workflow: the questions to ask, the data to surface, and the decisions to reach before anyone leaves the room. A complete pipeline review template includes: deal name, stage, amount, close date, next step, risk flag, forecast category, and the review questions that validate what the CRM says against what actually happened. |
The distinction between a pipeline review template and a sales pipeline management tracker matters. A sales pipeline tracks deals. A pipeline review template structures the meeting where you inspect those deals, surface what is stuck, and decide what needs to change before the quarter closes. One is the data layer. The other is the inspection layer on top of it.
Sales Pipeline Template vs. Pipeline Review Template
Searchers often use both terms interchangeably. They serve different purposes.
| Sales Pipeline Template | Pipeline Review Template | |
| Primary purpose | Store and track deals across stages | Inspect deals, surface risk, align on next steps |
| What it holds | Deal name, stage, value, close date, owner | Review questions, risk flags, forecast categories, next steps |
| Who uses it | Reps, primarily | Managers and reps, together |
| When used | Continuously, as deals progress | Weekly or monthly, in a structured review meeting |
| Output | A current view of the pipeline | A decision: what to push, what to disqualify, what to commit |
You need both, and they do different jobs. This guide covers the review template: the questions that make it useful, the formats it comes in, and the data foundation that makes it trustworthy.
Why Most Pipeline Reviews Fail
A pipeline review should function as a leading indicator of revenue forecasting accuracy — it tells you where the quarter is heading before the numbers are in. Most do not. They surface problems too late, produce no lasting change in deal outcomes, and leave both managers and reps feeling the time was poorly spent.
The failure modes are consistent across sales organisations:
- Stale CRM data at review time. Reps update the CRM the morning of the review, not as deals develop. The review reflects recall, not reality.
- Rep interrogation instead of strategy. When the manager does not have deal data before the meeting, the review becomes a Q&A session. Reps who feel questioned learn to present deals optimistically and withhold the problems they actually need help with.
- No deal disqualification. Stuck deals that are never removed inflate coverage ratios and produce false confidence in the forecast. High-performing teams target a 10% monthly disqualification rate (DocBeacon, December 2025).
- Funnel composition overlooked. Most reviews focus on individual deal activity and miss the broader question: are there enough deals in each stage to sustain a steady flow through the quarter?
- No consistent cadence. Reviews that happen monthly instead of weekly miss the window to intervene on stalling deals.
- No action items leaving the room. Reviews without documented next steps, named owners, and deadlines are theater, not management.
The thread connecting all of these is CRM data quality. A pipeline review is only as reliable as the data feeding it. When deal status is self-reported, that data is often outdated or optimistic. Gartner research shows that organisations that improve CRM data hygiene can increase forecast accuracy by up to 30% (Forecastio, May 2026, citing Gartner). The template below gives the meeting structure. The activity-based data section later in this guide explains how to make that structure trustworthy.
The Pipeline Review Template
The template has two views: a manager view that gives a team-level snapshot before the meeting starts, and a rep view that each rep fills in ahead of the meeting. The rep inputs roll up into the manager snapshot, so both sides walk in with the same picture of the pipeline.
Manager View: Team Pipeline Snapshot
The manager’s view gives a consolidated picture of the team’s pipeline before the meeting begins. It answers the question every manager needs to answer before anyone joins the call: where are we against quota, and which deals need attention today?

Manager View — Team Pipeline Snapshot. Review this before the meeting starts to identify coverage gaps and prioritise deal inspection time.
Before the meeting, the manager reviews this snapshot to identify which reps have meaningful pipeline gaps, which deals are holding up the commit number, and where to spend the inspection time. A manager who enters the review already knowing the gap does not waste 20 minutes discovering it.
Rep View: Weekly Deal Status
Each rep fills in the deal view before the meeting. This is the prep deliverable that transforms the review from an interrogation into a strategy session. The manager already has the status before the call begins, so the conversation starts with the deal, not with data collection.

Rep View — Weekly Deal Status. Each rep completes this before the meeting. The risk flag column is the most important field.
The risk flag column is the most important field in the rep view. A rep who flags a risk before the meeting opens the door to a coaching conversation. A rep who is not asked to flag risks and gets questioned about them in the meeting learns to hide risks entirely. Frame the template as a tool that protects the rep’s time, not as a performance scorecard.
Available Formats
Choose the sales pipeline format that fits your team’s workflow:
- Excel or Google Sheets: Best for teams that want flexibility and do not yet have a CRM-native review tool. Reps fill in their deal rows; the manager snapshot updates via formulas.
- Google Slides or PowerPoint: Best for forecast call presentations. Convert the manager snapshot into a slide that rolls up across teams for the VP Sales or CRO review.
- Google Docs or Microsoft Word: Best for narrative-style reviews or written summaries that capture deal context beyond what fits in a table.
- CRM-native or platform-based: The highest-value format for active deal management. Spreadsheets require manual updates before every review; CRM-native tools reflect what actually happened. The tradeoff is setup time and adoption effort.
The CRM-native format matters most when factoring in data currency. A spreadsheet filled out the morning of the review reflects what reps chose to write down. A CRM-native surface connected to automated activity capture reflects what reps actually did. That difference compounds in every forecast.
The 7-Question Pipeline Review Framework
Structured questioning beats ad-hoc deal review for one reason: it forces every deal to be evaluated against the same criteria every time. Salesforce’s own pipeline review guidance (June 2024) recommends developing two to three questions per pipeline stage with answers that clearly indicate whether a deal is ready to progress. This framework applies that principle across all deal stages. What no competitor’s framework includes is the specific data point that answers each question. That is the difference between a productive deal review and a gut-feel conversation.

The 7-Question Pipeline Review Framework. Each question is paired with the specific data point that answers it — not rep recall.
1. Is the deal real?
Why it matters: A real deal has a confirmed pain the buyer is funded and motivated to solve. Without confirmed need and budget, everything downstream — stage, close date, forecast category — is built on assumption.
Data point that answers it: Documented need and budget confirmation in discovery call notes or emails. If neither exists in writing, the deal is not real. The question every rep should be able to answer: why would they buy now rather than do nothing?
2. Who are the stakeholders, and is the economic buyer engaged?
Why it matters: Multi-stakeholder enterprise deals fail when the economic buyer is absent. A champion who supports the product but cannot release a budget is not enough. If the person with budget authority has never engaged, the deal will stall regardless of how far along the stage progression looks.
Data point that answers it: Contacts engaged on the deal and whether the economic buyer appears in recent email or meeting activity. Silence from the economic buyer for more than two weeks belongs in the risk flag column. Forecastio (2024) found that deals involving three or more engaged stakeholders close at a 68% higher rate than single-threaded deals.
3. What stage is the deal actually in?
Why it matters: Reps optimistically inflate CRM stages. A deal logged as Proposal Sent may still be missing the mutual action plan, stakeholder alignment, or technical sign-off that stage-exit criteria actually require.
Data point that answers it: Stage-exit criteria met versus logged stage. Require reps to reference specific buyer actions that validate the stage, not just their own activity. A deal without confirmed buyer-side momentum is not in the stage the CRM says it is.
4. What happened since the last review?
Why it matters: Momentum is the strongest real-time signal of deal health. A deal where activity is increasing is progressing. A deal where nothing has happened in 10 days is stalling, regardless of its logged stage.
Data point that answers it: Emails, meetings, and calls logged since the last review. If the answer is nothing, that silence is the data point. DocBeacon (December 2025) identified no contact for seven or more days as one of five primary red flags for deal failure. Teams that capture activity automatically have this answer before they walk into the room — this is the most direct connection to the activity capture advantage.
5. What is the single biggest risk to this deal?
Why it matters: Forcing the rep to name one primary risk prevents the vague optimism that makes pipeline reviews unreliable. A rep who says a deal has no risks either lacks real insight into the deal or is not being candid. Both are coaching situations.
Data point that answers it: Stalled next steps, no economic buyer engagement, competitor activity, a recent champion change, or a budget freeze signal in recent communication. The risk flag column in the rep view is where this gets documented before the meeting.
6. What is the next step, and is there a confirmed meeting on the calendar?
Why it matters: A deal without a scheduled next meeting is stalling. Following up is not a next step. A confirmed meeting with a confirmed attendee list and a confirmed agenda is a next step. The calendar does not lie; the rep’s intent to follow up does.
Data point that answers it: The calendar. Is the next meeting booked with a confirmed date and named attendee, or is the next step still described as following up? A deal with no scheduled next meeting should not appear in Commit.
7. Is the close date realistic, and what is the forecast category?
Why it matters: Close dates in CRM systems drift forward without documented reasons. A rep who has moved a deal’s close date twice without buyer evidence is surfacing something important about the deal’s actual health.
Data point that answers it: Average sales cycle length compared to time-in-stage, and alignment of the close date with the buyer’s confirmed decision timeline. Assign or confirm the forecast category based on evidence: Commit if criteria are met, Best Case if uncertain, Pipeline if early stage, Stuck if the deal has not progressed across two or more review cycles.
Why structured questioning produces better forecasts
Teams that run structured pipeline reviews against consistent criteria produce more accurate forecasts than those running ad-hoc reviews. The 7-question framework above forces every deal to be evaluated against the same evidence standard every time.
Salesforce guidance (June 2024): "Craft two to three questions for each stage. The answers should very clearly indicate whether or not a lead is ready to move down the pipeline."
How to Run a Pipeline Review Meeting
A pipeline review template gives the meeting structure. A repeatable pipeline review meeting agenda converts that structure into a system. The best practices for pipeline review meetings share three phases: preparation before the meeting, structured inspection during it, and documented follow-up after. The target is 30 minutes per rep in a 1:1 format.
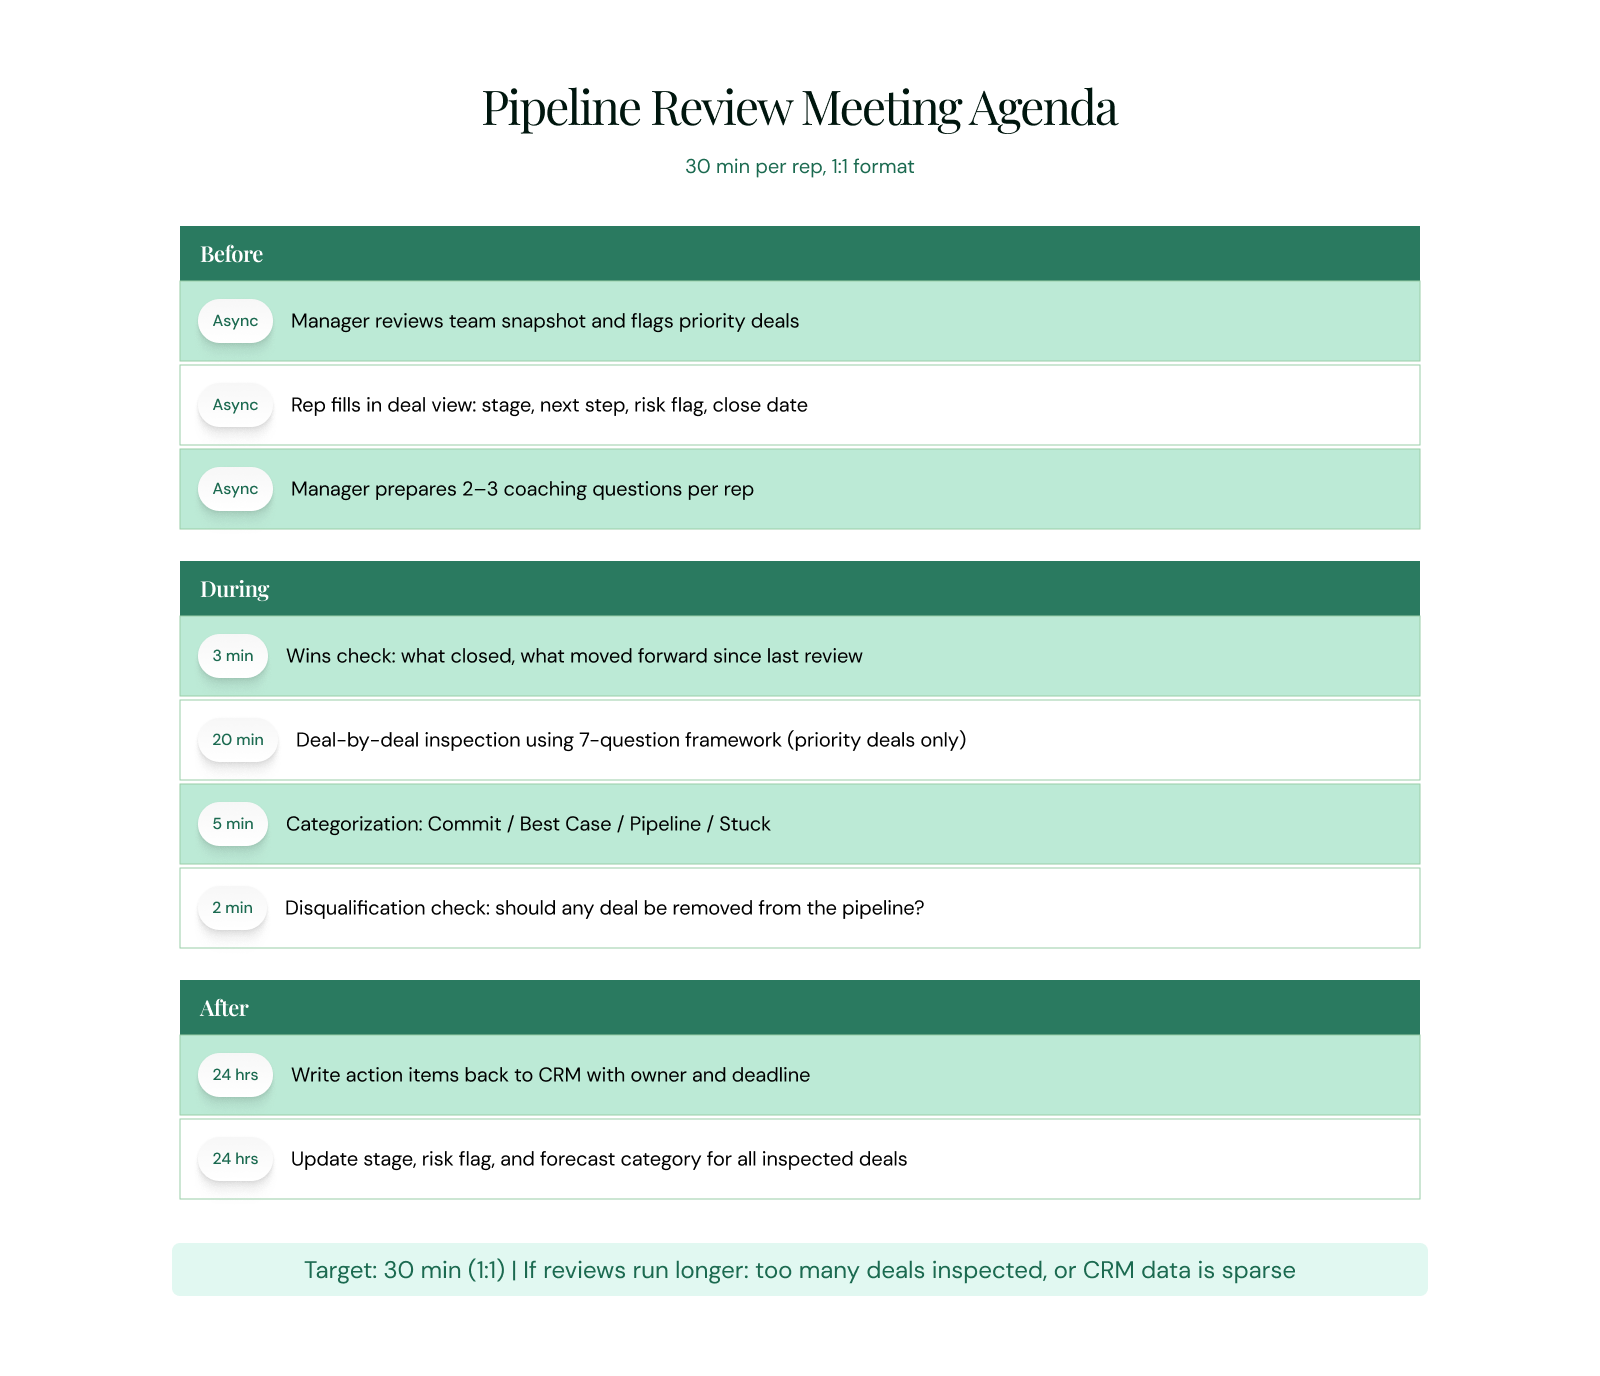
Time-Boxed Pipeline Review Agenda (30 min per rep, 1:1 format). Before = async prep. During = 3 min wins + 20 min inspection + 7 min categorisation and disqualification. After = CRM updates within 24 hours.
Before the Meeting: Preparation
The biggest obstacle to a productive pipeline review is not a bad agenda. It is empty data. When CRM fields are incomplete at meeting time, the review becomes a data collection exercise rather than a strategy session.
| Manager prep checklist |
|
| Rep prep checklist |
|
For teams managing large pipelines, manual prep at this scale is time-consuming. Revenue Grid’s Pipeline Assistant automates the discovery stage of this process, surfacing each deal’s latest email activity, meeting cadence, risk signals, and momentum data before the meeting begins. The manager walks in already knowing the state of every deal.
During the Meeting: Deal-by-Deal Inspection
Open with a three-minute wins review: what closed since the last meeting, which deals moved forward, which commitments were completed. Reviews that open with recognition create collaboration. Reviews that open with interrogation create defensiveness. Then apply the 7-question framework to each priority deal.
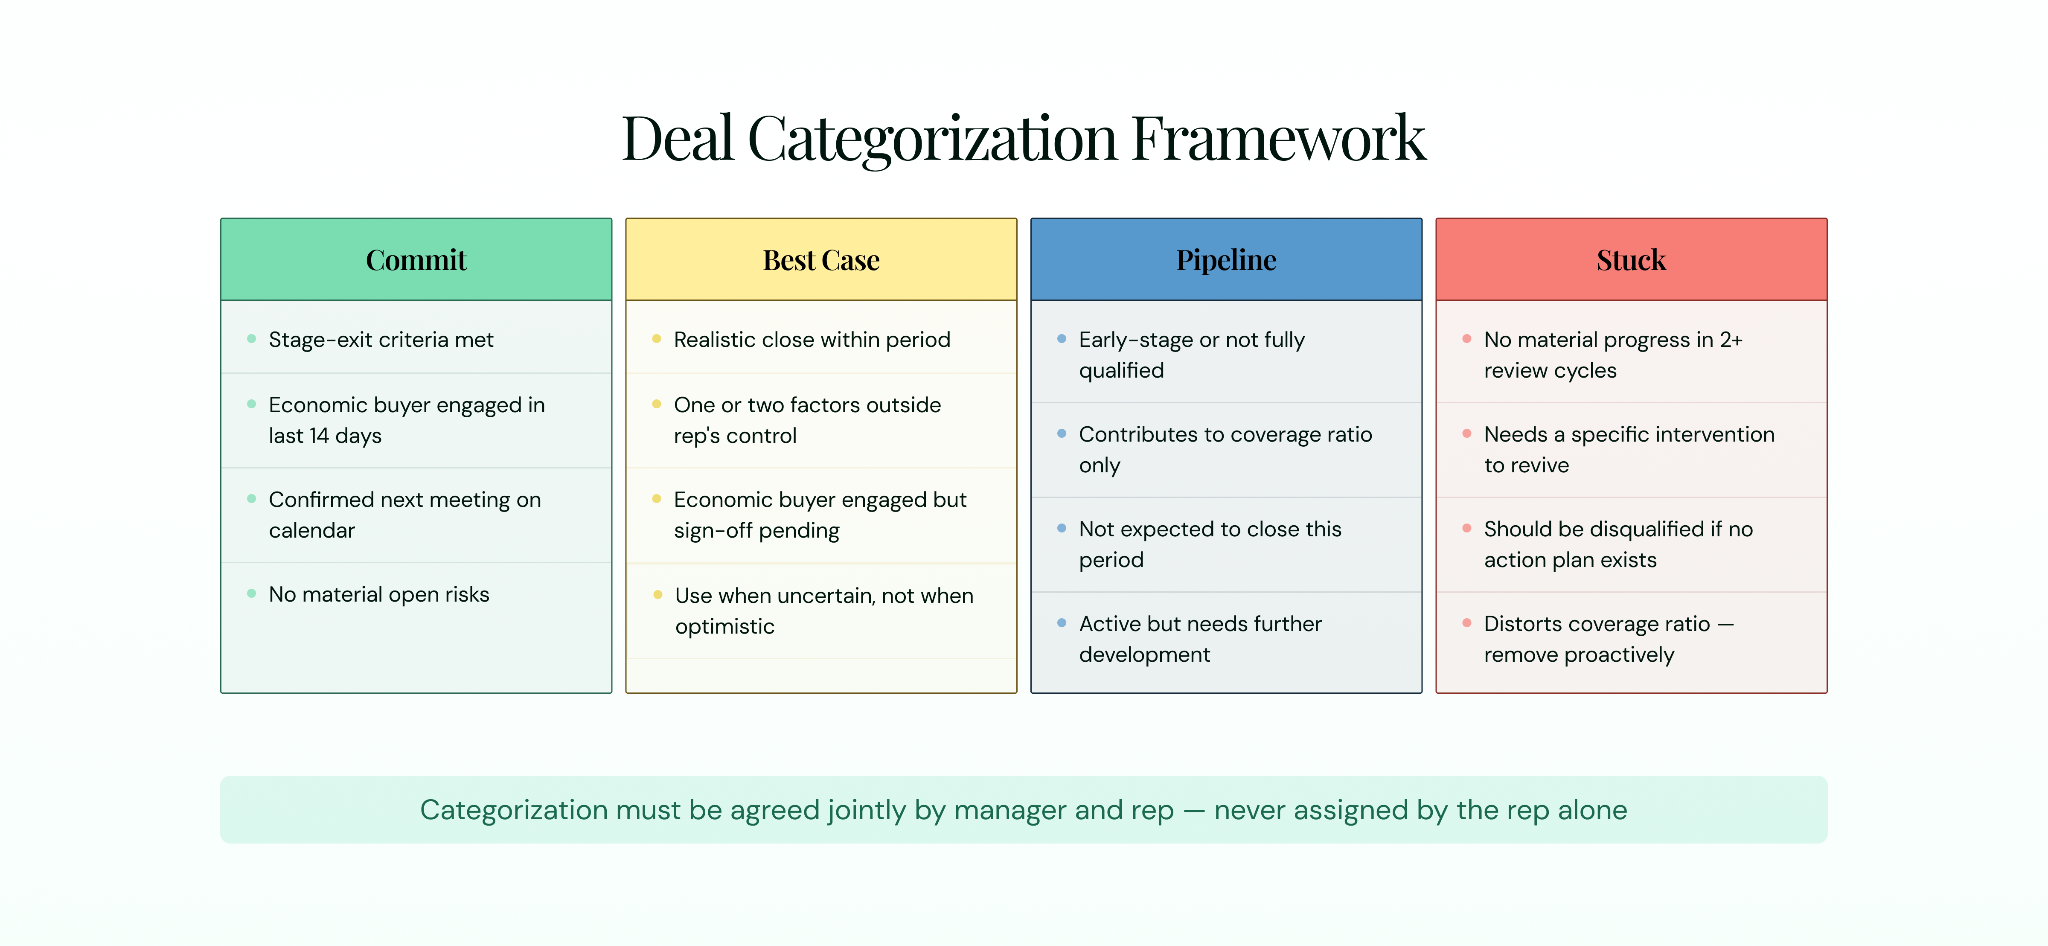
Deal Categorization Framework. Use these four categories after applying the 7-question framework to each deal. Categorisation must be agreed jointly.
Categorization decisions should be reached jointly. The manager and rep review the same evidence and agree on the category. End each deal discussion with one question: should this deal be disqualified? A pipeline with a healthy disqualification rate is more trustworthy than one where every deal survives every review.
After the Meeting: Action Planning and Follow-Up
A pipeline review without documented follow-up is theater. Every inspected deal should leave the meeting with a documented action, a named owner, and a deadline. Changes agreed in the meeting should be written back to the CRM before the end of the day. As one Head of RevOps at Stability AI noted: “The managers that drive consistent results are the ones showing the CRM screen during weekly meetings and holding reps accountable inside the system, not in spreadsheets” (AccountAim, June 2025).
| Action | Owner | Deadline | Deal |
| Schedule call with economic buyer | [Rep name] | [Date] | [Deal name] |
| Update stage or disqualify if no response | [Rep name] | [Date] | [Deal name] |
| Escalate procurement blocker to manager | [Manager name] | [Date] | [Deal name] |
If the same action item appears in three consecutive reviews without resolution, that is the most important topic in the next meeting — not the action itself, but why it has not moved.
1:1 vs. Team Pipeline Reviews
Both formats serve a purpose. They do not serve the same purpose, and mixing them up is one of the most common structural mistakes in pipeline management.
| 1:1 Pipeline Review | Team Pipeline Review | |
| Best for | Deal inspection, coaching, candid risk discussion | Pipeline health trends, shared learning, forecast roll-ups |
| Cadence | Weekly for active deal management | Monthly or quarterly for strategic alignment |
| Duration | 30 minutes per rep | 45 to 60 minutes maximum |
| Depth | Deal-level: every active deal in the 60-day window | Portfolio-level: trends, benchmarks, team coverage |
| Coaching value | High: direct, private, specific to the rep’s deals | Low for individual deals; better for methodology reinforcement |
| Risk | Low: rep speaks freely; manager can deliver real feedback | High: reps present optimistically when peers are watching |
Salesforce’s own guidance (June 2024) recommends 1:1 reviews as the primary format for deal inspection. Sybill.ai (June 2026) makes the point plainly: group reviews where each rep gives a status update while the rest of the team checks emails are “universally hated and almost always unproductive.” Reserve team reviews for monthly strategic sessions on pipeline health trends. Run the actual deal inspection in 1:1s.
Pipeline Health Metrics to Track in Every Review
Metrics are what separate a review that feels productive from one that is productive. The right pipeline health metrics turn the review from an anecdotal conversation into a predictive instrument, a way to conduct a pipeline review using analytics, not instinct. Teams tracking pipeline metrics weekly achieve 87% forecast accuracy, compared to 52% for teams tracking monthly (Digital Bloom, 2025, via ORM-tech, March 2026).

Pipeline Health Metrics Dashboard. Seven metrics with formulas and healthy benchmarks. Use these to make every review measurable, not just structural.
Pipeline Coverage Ratio
Formula: Total pipeline value divided by quota.
Healthy benchmark: 3x to 4x for most B2B sales teams. Stable mid-market SaaS teams in 2026 commonly target 3x; teams with lower win rates or more volatile cycles should target 4x to 5x. A ratio below 3x signals insufficient pipeline. A ratio above 5x often signals a pipeline bloated with unqualified deals.
How to use it: Check coverage at team level first, then by rep. A rep with 6x coverage but no deals in Commit has a quality problem, not a volume problem.
Sales Velocity
Formula: Number of active deals multiplied by average deal value, multiplied by win rate, divided by average sales cycle length.
Why it matters: Sales velocity is the rate at which the pipeline converts to revenue. Rising velocity means deals are progressing faster or winning at a higher rate. Falling velocity signals either a lengthening cycle or a declining win rate — each requiring a different intervention.
Win Rate
Formula: Closed-won deals divided by total deals closed, expressed as a percentage.
Healthy benchmark: 19% is the median B2B win rate as of 2025 (Ebsta x Pavilion, Gradient Works, March 2026). Enterprise deals with multiple stakeholders and cycles of 30 or more days often run 15% to 25%.
How to use it: A rep with a 12% historical win rate committing five deals in a quarter has an expected outcome below one closed deal. That is a coaching conversation before it becomes a forecast miss.
Average Sales Cycle Length
Definition: The average number of days from first meaningful buyer engagement to closed-won or closed-lost.
How to use it: Flag any deal in the 60-day close window that has been in its current stage longer than the average stage duration. Use age buckets — 0 to 30 days, 31 to 60, 61 to 90, 90-plus — to surface pipeline aging across the full team at a glance.
Deal Slippage Rate
Definition: The percentage of deals that push their close date from one review period to the next.
Why it matters: A deal that slips once has a problem. A deal that slips two or more times in consecutive reviews is effectively stuck. Chronic slippage distorts the forecast and signals either a qualification problem or a stalled buyer process.
Average Deal Size
Definition: The average closed-won value across all deals in a defined period.
How to use it: A large-deal-heavy pipeline requires more deal-level scrutiny in every review because each slip has an outsized impact on the forecast. Coverage math looks different for four large deals versus 40 small ones, even at the same total pipeline value.
Stalled Deals
Definition: Deals with no logged activity in a defined number of days: seven to ten for short-cycle teams, 14 to 21 for enterprise cycles.
How to use it: Surface stalled deals at the top of the agenda. If a deal has not moved in 21 days on a 90-day cycle, disqualify it or escalate it. DocBeacon (December 2025) recommends a 10% monthly disqualification rate for teams with healthy pipelines. Stalled deals that survive every review inflate coverage ratios and create false confidence in the forecast.
Forecasting From Your Pipeline Review
The pipeline review and the sales forecast are not separate processes. The review is where the inputs that feed the forecast get validated. A commit number built on deals that have not been reviewed against the 7-question framework is not a commit, it is a hope dressed as a number.
Forecast Categories
| Pipeline Review Forecast Categories
Commit: Deals the rep is highly confident will close within the period. Stage-exit criteria met. Economic buyer engaged. Confirmed next meeting. No material open risks. Best Case: Deals that could close if key factors go the rep’s way: a final approval, a stakeholder sign-off, a pricing conversation. Pipeline: Active deals that contribute to coverage but are not expected to close in the current period. Booked: Already closed. Included for completeness in the roll-up view. |
Weighted Revenue Calculation
Weighted revenue applies a probability to each forecast category to produce a more realistic expected outcome than summing the full value of all committed deals.
| Worked Example: Weighted Revenue Calculation
Commit: $400K at 90% probability = $360K weighted revenue Best Case: $200K at 60% probability = $120K weighted revenue Pipeline: $600K at 20% probability = $120K weighted revenue Total weighted forecast: $600K versus $1.2M total pipeline value |
Forecast accuracy depends on the quality of the review inputs. Companies that improve CRM data hygiene can increase forecast accuracy by up to 30% (Gartner, via Forecastio, May 2026). Because Revenue Grid captures activity automatically rather than relying on self-reporting, teams using activity-based forecasting can reach up to 96% forecast accuracy. The practical ceiling for any review is the trustworthiness of the data feeding it.
Why Activity-Based Data Makes Reviews Trustworthy
The best practices for reviewing sales pipeline activity share one foundational premise: the review is only as accurate as the data it inspects. A structurally sound pipeline review running on self-reported CRM data still produces a distorted picture of the pipeline, because the data reflects what reps chose to enter, not what actually happened in the deal.
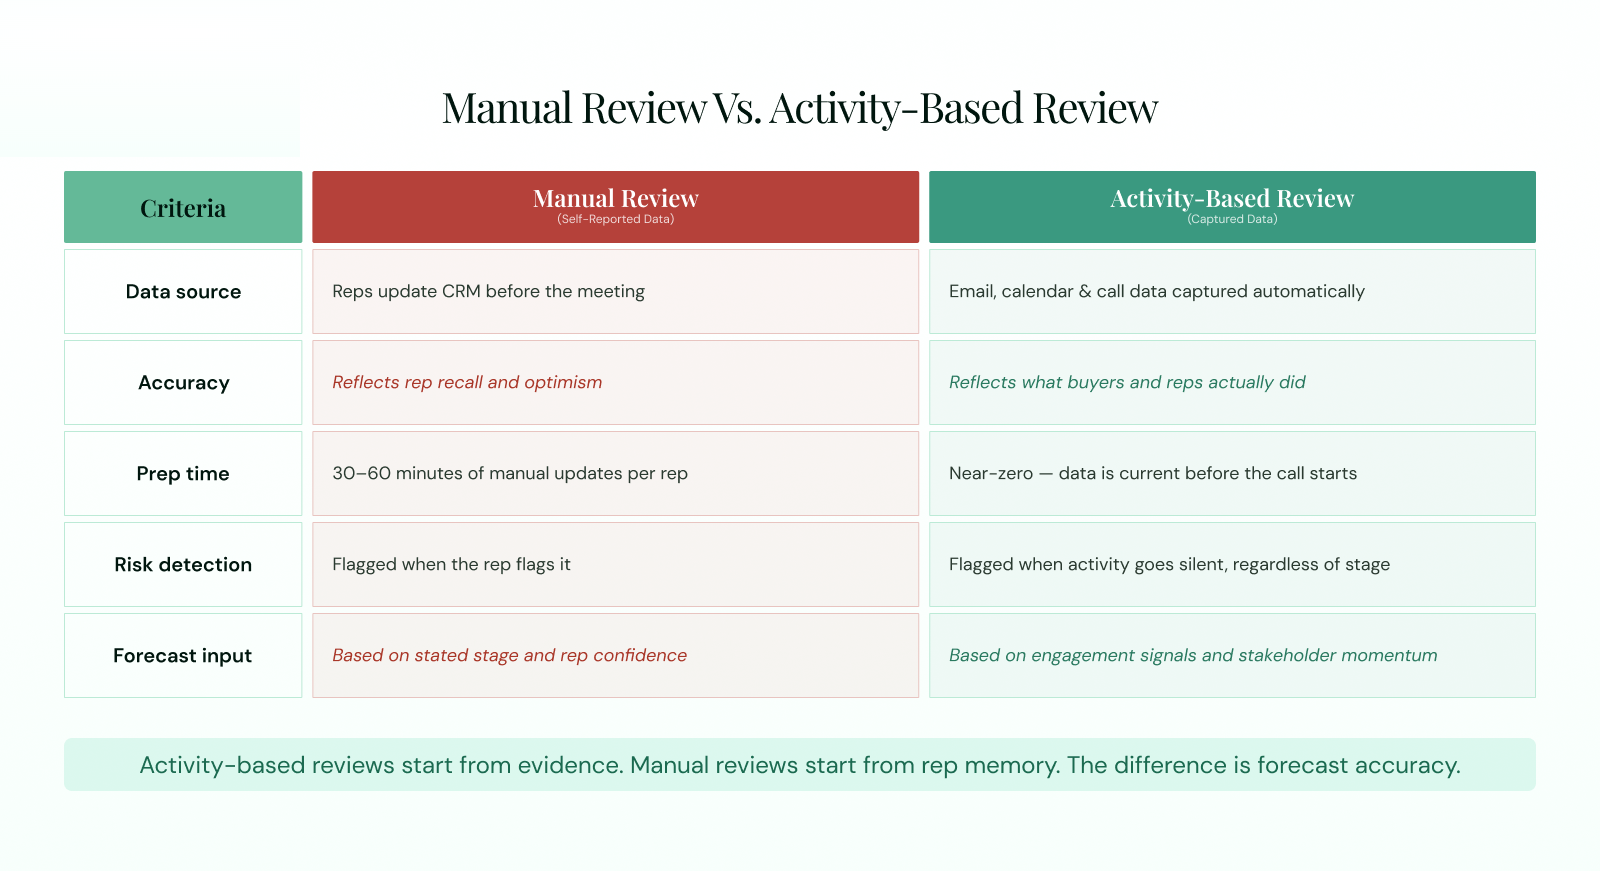
Manual Review vs. Activity-Based Review. The left column is why most reviews feel unreliable. The right column is what trustworthy reviews are built on.
The reason most pipeline reviews feel unreliable is captured in the left column above. Reps who update their CRM the morning of the review are giving the manager their best reconstruction of deal status, not a factual account of what happened since the last meeting. Sybill.ai (June 2026): “The biggest obstacle to great pipeline reviews is not the agenda. It is the data. When CRM fields are empty, reviews become interrogation sessions. When deal data is accurate and current, reviews become strategic coaching conversations.”
Revenue Grid addresses this at the structural level. Its automatic activity capture logs emails, meetings, and calls into Salesforce as native records, with no rep effort required. The Pipeline Assistant enriches each deal with activity signals, risk flags, and momentum data before the review begins. Managers see a pipeline that reflects actual buyer behaviour, not rep-reported stages.
Vapotherm, a medical device manufacturer, recovered 761 person-days of sales capacity through automated activity capture, with 110,000 emails and 27,000 calendar events logged without rep effort. Slalom, a professional services firm, attributed $30M in pipeline to a one per cent improvement in meeting coverage after deploying Revenue Grid. See how automated activity capture changes the pipeline review experience in practice.
From Template to Repeatable System
A pipeline review template standardizes the meeting. The 7-question framework adds rigour to each deal inspection. The pipeline health metrics make the review predictive rather than anecdotal. Trustworthy data makes it defensible when the forecast is challenged. These four elements work together, remove any one and you get a process that is better than nothing but still falls short of reliable sales forecast accuracy.
The natural next step from a structured manual review is an automated, activity-based process where the discovery stage completes itself before the meeting begins. The manager arrives knowing the pipeline. The rep arrives having done nothing more than sell. The review is a strategy session, not a status call. To see how automated pipeline reviews and 360-degree pipeline visibility work in practice, book a demo below.
A template gives you a consistent review. Trustworthy activity data gives you a defensible forecast.
What is a pipeline review template?
A pipeline review template is a standardized structure for inspecting deals, surfacing risk, and aligning on next steps during a recurring sales review meeting. It includes a team pipeline snapshot for managers, a deal-level view for reps, and a question framework that validates deal health. It is a meeting and inspection tool, not a deal storage system.
What should a pipeline review template include?
A complete pipeline review template includes, in the rep view: deal name, stage, amount, close date, next step, risk flag, and forecast category. In the manager view: rep name, commit, best case, pipeline value, quota, gap, and coverage ratio. The 7-question framework is the inspection layer that validates what those fields say.
How often should you run a pipeline review?
Run pipeline reviews weekly in 1:1 format for active deal management, particularly for deals in the 60-day close window. Run monthly team-level reviews for strategic pipeline health analysis. Cadence should match deal cycle length: teams with 30-day cycles need weekly reviews; teams with 90-plus day enterprise cycles may run 1:1 reviews every two weeks.
What is the difference between a pipeline review and a forecast review?
A pipeline review inspects individual deal health: progress, risk, next steps, and categorization. A forecast review rolls up committed revenue across reps and regions to produce a period number. They are sequential: the pipeline review validates the deals that feed the forecast. Skipping the pipeline review and going straight to a forecast call produces a number nobody fully believes.
What questions should you ask in a pipeline review?
The 7-question framework in this guide covers: is the deal real; who are the stakeholders and is the economic buyer engaged; what stage is the deal actually in; what has happened since the last review; what is the single biggest risk; what is the confirmed next step and is there a calendar invite; and is the close date realistic with a confirmed forecast category. Each question has a specific data point that answers it.
How do you run a pipeline review without interrogating reps?
Share the pipeline template with reps before the meeting so they fill it in asynchronously. Have the manager review the snapshot before the meeting so status is already known. Open each deal with the data, not with a question requiring the rep to recall it from memory. Revenue Grid’s Pipeline Assistant completes the discovery stage automatically, surfacing deal activity, risk signals, and momentum data before the meeting begins, so the conversation starts from evidence rather than recall.
What format is best for a pipeline review template?
Spreadsheets — Excel or Google Sheets — are the fastest starting point and the most flexible sales pipeline format. Google Slides or PowerPoint work best for forecast call presentations. CRM-native formats are the most defensible over time because deal data stays current automatically rather than being updated manually before each review.
What metrics should you track in a pipeline review?
Track seven pipeline health metrics in every review: pipeline coverage ratio (healthy benchmark: 3x to 4x), sales velocity, win rate (median 19% for B2B), average sales cycle length, deal slippage rate, average deal size, and stalled deals (no activity in seven to 21 days). Each has a formula and benchmark covered in the metrics section above.