
Key Takeaway
- Sales productivity metrics help teams measure efficiency, optimize pipelines, and improve revenue performance
- Tracking conversion rate, win rate, sales cycle length, deal size, and retention reveals key growth opportunities
- Leading and lagging indicators together provide a complete view of sales performance
- Poor CRM processes, lack of training, and inefficient workflows reduce sales productivity
- Revenue Grid helps sales teams automate data capture and turn insights into faster, smarter decisions
What Are Sales Productivity Metrics?
Sales productivity metrics are quantifiable measures that help sales managers evaluate how efficiently their teams convert time, effort, and resources into revenue. Unlike basic sales KPIs that simply track outcomes, productivity metrics focus on the efficiency and effectiveness of your sales process, helping you identify bottlenecks and optimization opportunities.
These metrics serve three critical purposes:
- Diagnose performance issues before they impact revenue
- Guide coaching and training decisions for individual reps
- Optimize resource allocation across your sales funnel
What you cannot measure, you cannot improve. The most commonly misunderstood aspect of the entire sales management processes is the design and the use of metrics.
At Revenue Grid, we believe the right sales metrics empower your team to exceed targets and drive sustainable growth. But how do metrics fit into the role of an average sales manager?
Chances are that every sales manager already tracks three metrics within their selling process: calls (or meetings) per day, profitability per salesperson, and target achievement per person. While these metrics may be normal for those still living in the Stone Age, they do not focus on improving the sales funnel.
The sales funnel provides a window into the effectiveness of your entire sales process. If you break down the sales cycle into sequential steps and track the progress of each sales opportunity, your sales forecasts can become more accurate, and you can diagnose which important opportunities require extra support.
Unlike generic CRM solutions, Revenue Grid leverages advanced AI to automatically capture and surface actionable sales insights—reducing manual data entry and empowering sales managers to make data-driven decisions faster. Companies that purchase traditional CRM systems expect them to solve all of their problems.
A CRM can help manage the accuracy of sales data and monitor the performance of sales staff, but it does not actively improve the sales processes. We can generate extremely detailed reports, but often we do not know what to do with all this information, and we risk developing “analysis paralysis.”
Types of Sales Productivity Metrics
Sales productivity metrics fall into two main categories:
Leading Indicators
These metrics predict future performance and help you course-correct before problems impact revenue. Examples include activity metrics (calls made, emails sent), pipeline velocity, and early-stage conversion rates.
Lagging Indicators
These metrics reflect past performance and show the results of your sales activities. Examples include closed-won deals, revenue achieved, and customer retention rates.
The most effective sales teams track both types to get a complete picture of their performance and pipeline health.
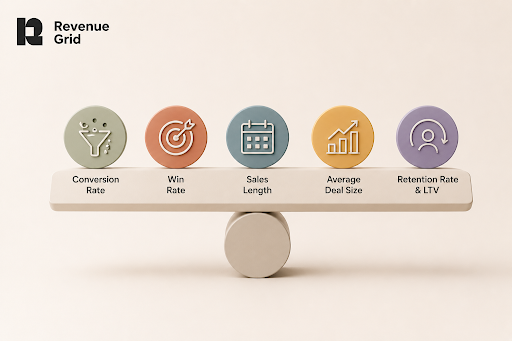
Key Takeaways: Essential Sales Productivity Metrics
- Conversion Rate: Track lead-to-sale performance across funnel stages
- Win Rate: Measure ratio of closed deals to qualified opportunities
- Sales Length: Monitor average time to close deals
- Average Deal Size: Identify revenue drivers and deal value trends
- Retention Rate & LTV: Focus on long-term customer value
Below you will find the 5 most essential metrics you can easily track with your CRM system and improve your sales funnel.
Sales Productivity Metrics Comparison Table
The following table summarizes each essential sales productivity metric, its type, and measurement approach for quick reference:
| Metric | Type | How to Measure | Industry Benchmark |
| Conversion Rate | Lagging | Closed deals ÷ Total leads | 2-5% (varies by industry) |
| Win Rate | Lagging | Won deals ÷ Qualified opportunities | 33% (1 in 3 opportunities) |
| Sales Length | Leading | Average days from lead to close | 84 days (B2B average) |
| Average Deal Size | Lagging | Total revenue ÷ Number of deals | Varies by industry/product |
| Retention Rate | Lagging | Retained customers ÷ Total customers | 60-75% minimum |
This comparison table helps you quickly identify which metrics to prioritize based on your current sales challenges and goals.
1. Conversion rate.
“Conversion rate” is a standard method of getting insights into sales team performance. It provides a great starting point for getting a general overview of sales process effectiveness. How many leads or opportunities generated one sale?
Conversion rate is only one aspect of the productivity scale, but if you measure the number of opportunities each stage of the sales funnel produces, you can see the pathways to improving your sales team’s performance more easily.
Best Practice: Track conversion rates at each stage of your funnel (lead to MQL, MQL to SQL, SQL to opportunity, opportunity to close) to identify specific bottlenecks and coaching opportunities.
2. Win rate.
How many proposals were offered before the deal was closed? “Win rate” is the ratio of closed deals to viable opportunities. The industry average is around 1 win for every 3 opportunities.
If your company has a lower win rate than this average, you may have to reanalyze the relevance and strength of your company and product value. Your sales team’s performance can influence your win rate either positively or negatively.
Timely reach outs and personalized communication with a potential client can boost the process of closing a deal. An untimely contact, a lack of individual approach in the sales process, and so forth will suppress win rates below the average.
SaaS Example: A mid-market SaaS company improved their win rate from 25% to 40% by implementing better lead qualification criteria and providing sales reps with competitive battle cards for common objections.
3. Sales length.
The average time between opening and closing an opportunity is your average “sales length,” the time required to nurture a lead from seed to harvest.
This metric is a necessary gauge of customer behavior. By understanding the amount of time needed to close deals, you can effectively design campaigns and manage expectations in nurturing your leads.
A prospective buyer begins their journey through the sales funnel and becomes a lead as soon as your sales team contacts and engages them. When the deal is closed, your product has satisfied all customer needs and your sales rep successfully placed an end date on the length of the sales.
Watch Out: Deals that take significantly longer than your average sales length often indicate qualification issues or lack of urgency. Use this metric to identify deals that need intervention.
4. Average deal size.
As a sales manager, you need to ensure your sales team is managing their time effectively. Your team may be too focused on winning small deals because it is easy to close a small opportunity rather than pursue the most profitable one.
If your average deal size is small, focus on your lead generation process, and try to identify the reasons your sales team is producing so many small leads. Coach your team to increase the average deal size rather than just the number of gross sales.
Tip: Track deal size by rep and by lead source to identify which reps excel at larger deals and which marketing channels generate higher-value prospects.
5. Retention rate and Customer Lifetime Value (LTV).
A healthy business retains a minimum 60% of its customers and actively cultivates a relationship with those who are ready to buy more.
Starbucks, an industry leader, has a retention rate of 75% – three out of four customers who purchase their product will return for more, and returning customers can access benefits that reinforce their loyalty.
Increasing customer lifetime value (LTV) significantly improves profit. Measurements of customer LTV tend to focus on the relationship with a client over time by tracking metrics such as customer satisfaction rate, level of customer loyalty, net promoter score, and more.
“Revenue Grid helped us increase our conversion rate by 20% in just three months by making our sales data actionable. The AI insights showed us exactly where our reps were losing deals.”
— Sarah Chen, VP of Sales, TechFlow Solutions
How to Choose the Right Sales Productivity Metrics
Not all metrics are equally important for every sales team. Consider these factors when selecting which productivity metrics to prioritize:
- Business Goals: Align metrics with your primary objectives (growth, efficiency, retention)
- Sales Process Stage: Focus on metrics that match your sales maturity level
- Team Structure: Consider whether you have inside sales, field sales, or hybrid teams
Industry Dynamics: Account for typical sales cycles and buying behaviors in your market
Common Mistakes When Tracking Sales Productivity Metrics
Avoid these common pitfalls that can undermine your metrics program:
- Tracking Too Many Metrics: Focus on 5-7 key metrics rather than overwhelming your team with dozens
- Only Measuring Lagging Indicators: Balance outcome metrics with predictive leading indicators
- Failing to Act on Insights: Metrics are only valuable if they drive coaching and process improvements
- Ignoring Context: Consider external factors like seasonality and market conditions
- Poor Data Quality: Ensure your CRM data is accurate and consistently updated
All successful managers have to establish an optimization rate for the sales process to improve their employees’ performance.
Signs of Low Sales Productivity and How to Address Them
1. Ineffective time management within the CRM system.
Your team has to track sales leads in Salesforce or another CRM system, but it can be a time-consuming process for salespeople. If you want your sales team to invest more time in generating leads and improving customer LTV, bring Salesforce directly to their workplace through Outlook. Read more about our Revenue Grid’s AI data capture solution and how to integrate Salesforce with Outlook using Revenue Grid.
Find out how Revenue Grid uses AI to make it happen
Unlock Sales Insights—Book a Demo
2. Your sales team needs training and continued education.
If you find that your employees have poor knowledge of the product or their sales skills could be improved, you need to create a knowledge and skill assessment and create a personal development plan for each salesperson on your team.
3. Your department’s internal processes are messy.
Tracking employees’ work time, establishing a clear division of responsibilities, and mandating regular reporting may seem to improve record-keeping at the office, but too many steps in the process can diminish the effectiveness of the sales process itself. You must not only clarify responsibilities and deadlines, but also motivate and engage your employees. Departments tend to add steps to their internal processes regularly, but rarely do they revisit these to slim them back down and boost their effectiveness for team engagement.
How do you measure sales productivity?
Sales productivity is measured by tracking key metrics like conversion rates, win rates, average deal size, sales cycle length, and customer lifetime value. The most effective approach combines leading indicators (predictive metrics) with lagging indicators (outcome metrics) to get a complete picture of team performance.
What are KPI in sales productivity?
Sales productivity KPIs are specific, measurable indicators that track how efficiently your sales team converts effort into revenue. Key KPIs include pipeline velocity, quota attainment, activity-to-outcome ratios, and customer acquisition cost. These differ from basic sales KPIs by focusing on efficiency rather than just results.
What is a good conversion rate for B2B sales?
B2B conversion rates typically range from 2-5% from lead to closed deal, though this varies significantly by industry, deal size, and lead source. SaaS companies often see 3-5%, while enterprise software may see 1-3% due to longer, more complex sales cycles.
How often should sales productivity metrics be reviewed?
Review leading indicators (like activity metrics) weekly, core productivity metrics monthly, and strategic metrics (like LTV) quarterly. This cadence allows you to make tactical adjustments quickly while maintaining focus on long-term trends and goals.