Key Takeaway
- Sales performance tracking prevents missed forecasts, stalled deals, and revenue leakage.
- Core metrics to track include pipeline coverage, win rate, sales cycle length, forecast accuracy, activity volume, quota attainment, and stage-to-close rate
- Prioritizing actionable metrics over vanity metrics leads to stronger decisions and improved sales performance.
- Forecasting discipline is built on historical data, real buyer signals, and accountability.
- Tools like Revenue Grid automate activity capture, reveal pipeline health, and guide reps with AI-driven nudges.
Every quarter brings higher revenue targets, yet many sales teams still operate in the dark. They rely on CRMs built for data entry, not for the way modern sales actually happen. Conversations unfold across emails, LinkedIn messages, calls, and meetings, but only fragments make it into the system.
That’s why pipeline visibility often feels like guesswork. Dashboards show deal stages, but not the buyer’s real intent or engagement level. The result? Forecasts drift from reality, reviews turn reactive, and strategy leans on assumptions instead of evidence.
This article breaks down how to fix that. You’ll see how to capture actual buyer activity across every channel, connect it into one reliable view, and understand how platforms like Revenue Grid make that clarity possible, minus all the extra admin work.
What Is Sales Performance Tracking?
Sales performance tracking is the process of measuring, analysing, and improving every activity that contributes to revenue. It goes beyond counting calls or emails, it connects effort to outcome.
At its best, it helps sales leaders answer three questions:
- Where are deals slowing down?
- Which activities drive conversions?
- How accurate is our forecast?
Tracking these insights in real time keeps the team proactive instead of reactive. It’s how high-performing organizations maintain discipline, consistency, and confidence in their numbers. On the other hand, there could be ill effects that spread throughout the business when tracking fails.
What Happens When Tracking Fails
When tracking falls apart, the symptoms show up quietly at first. Forecasts look fine. Dashboards appear full. However, behind the charts, deals age without progress, and activity data becomes unreliable.
Cloudflare experienced this in 2023. Despite strong growth, they cut their revenue forecast after deals dragged longer than expected and too many closed late. The issue wasn’t pipeline shortage, it was visibility.
Poor sales performance tracking creates a ripple effect across teams. Here’s what typically goes wrong:
Poor visibility across the sales funnel
Leaders spot risks too late because dashboards rely on outdated data. According to Salesforce (2023), 39% of sales professionals say inaccurate forecasts stem from poor data quality.
Low CRM adoption
A CRM is only as good as its usage. In 2025, just 34% of teams report full adoption, leaving most companies with incomplete or inconsistent data sets.
Manual data entry
Sales reps spend only 28% of their time selling (Salesforce State of Sales, 5th Edition). The rest goes to admin: logging calls, updating fields, writing notes. Valuable selling time lost to data chores.
Missed coaching opportunities
When coaching relies on guesswork, performance stalls. Teams with structured coaching programs record a 28% higher win rate (State of Coaching Report, 2024). Without visibility, managers can’t guide reps effectively.
These issues don’t stay operational for long. They quickly translate into missed forecasts, wasted pipeline, and slower revenue growth. To avoid this, organizations need to ensure that they are measuring the correct metrics.
Are You Tracking the Right Metrics?
Many sales teams track activity but not impact. They measure how busy their reps are, not how effective.
Metrics like “total calls made” or “emails sent” look impressive but reveal little about deal quality. In contrast, actionable metrics, such as conversion rates between stages or forecast accuracy, help leaders identify real blockers.
Here’s how to tell the difference:
| Vanity Metric | Actionable Metric |
|---|---|
| Total calls made | Call-to-meeting conversion rate |
| Emails sent | Response rate per campaign |
| Meetings booked | Opportunities created from meetings |
| Leads generated | Sales-qualified opportunities (SQLs) |
Tracking activity alone paints an incomplete picture. You might have 1,000 leads in your funnel, but if only 5 become customers, the system isn’t healthy and needs intervention.
Proposify, a mid-market SaaS platform, learned this the hard way. Their dashboards were packed, but deals moved slowly, and close rates lagged. The fix was simple but strategic: they shifted focus from call volume to stage-to-close rates and improved early qualification. Within a quarter, win rates rose from 23% to 30%, and time to close dropped by half.
The lesson is that measuring fewer, more meaningful metrics is far more powerful than tracking everything that moves.
The Sales Metrics That Matter Most
The right metrics reveal not just where you stand but how to improve. These seven indicators form the backbone of any strong sales performance tracking strategy.
1. Pipeline Coverage
Shows how much pipeline you have compared to your target. The healthy benchmark is 3x quota. If your quarterly goal is $100,000, you should have at least $300,000 in qualified pipeline. Anything less signals an uphill quarter.
2. Win Rate
Tracks how many opportunities convert to closed deals. The SaaS industry average is about 22%; top performers hit 35% or more. If your win rate declines, it’s often a qualification or enablement issue.
3. Sales Cycle Length
Measures how long it takes to move a deal from first contact to close. The longer the cycle, the higher the risk of losing momentum. Monitoring cycle time helps diagnose bottlenecks before they hit revenue.
4. Forecast Accuracy
Shows how close predicted revenue is to actuals. Consistent misses signal poor data or overconfidence in deal quality. Accurate forecasts build leadership credibility and help teams plan confidently.
5. Activity Metrics
Counts rep efforts (calls, emails, meetings), this should always be paired with conversion outcomes. Automated activity capture prevents gaps, giving leaders visibility without burdening reps.
6. Quota Attainment
Indicates how many reps hit their targets. Repeated misses often point to systemic issues in goal setting, enablement, or coaching, not individual underperformance.
7. Stage-to-Close Rate
Reveals the percentage of opportunities that move from a given stage (like “Proposal”) to a win. Tracking this helps pinpoint where deals stall and where reps need more support.
These metrics don’t just describe performance, they guide decisions. Together, they form an honest pulse of pipeline health and predictability.
Why Tracking Affects More Than Sales
Sales data doesn’t belong only to sales. When tracked and shared properly, it becomes the foundation for smarter cross-functional collaboration.
Marketing: Better lead quality
By reviewing conversion data, marketing teams can refine campaigns to generate leads that actually close. Understanding which personas or messages convert fastest helps marketing invest where it matters most.
Finance: Reliable revenue planning
When forecasts are grounded in data, not optimism, finance teams can plan headcount, budgets, and cash flow with precision. Consistency builds trust across departments.
Customer Success: Stronger renewals and expansions
With full visibility into deal history, CS teams understand what was promised during sales. They can spot renewal risks early and identify expansion-ready accounts with confidence.
When these functions work from the same data source, performance improves across the entire revenue engine.
Moving Beyond Static Dashboards
Traditional dashboards show what happened. But by the time a red flag appears, the damage is usually done. Data snapshots are backward-looking; they explain outcomes after the fact.
AI insights change that equation. Instead of waiting for a weekly review, AI surfaces risks as they happen, like deals that have gone silent for two weeks, or accounts showing low engagement despite high value.
Here’s what modern teams track with AI:
- Inactivity gaps: No contact in the past 7+ days
- Engagement drops: Buyer stopped responding after pricing discussions
- Forecast contradictions: Large deal marked “committed” but no recent activity
- Low multithreading: Only one stakeholder involved in late-stage deals
The goal isn’t more data. It’s timely, contextual action. AI helps sales teams focus attention where it matters before deals fall through the cracks.
How to Implement Effective Sales Performance Tracking
Success comes from a mix of clear metrics, structured reviews, and the right technology. Here’s a practical framework that works for most B2B teams:
1. Identify internal and external factors
Track both execution (activity levels, rep performance) and market dynamics (buyer timelines, budget cycles). Ignoring either creates blind spots.
Revenue Grid’s Pipeline Evolution Report helps visualize this, showing how opportunities have historically progressed and whether slippage is caused by internal habits or external delays.
2. Improve pipeline visibility
Audit deals that have been stuck too long, monitor accounts with no recent activity, and track stage-to-stage progression. Revenue Grid sends real-time alerts when opportunities stall or accounts go quiet, giving managers time to intervene.
3. Strengthen forecasting discipline
Combine historical conversion rates with live buyer signals. Require reps to justify forecasts with real data. Revenue Grid’s Revenue Signals automatically flag inconsistent forecasts or at-risk deals so adjustments happen early.
4. Choose the right tools
Manual tracking doesn’t scale. Mature teams use CRMs as their foundation but extend them with automation and AI layers.
A strong sales tech stack includes:
- A well-adopted CRM
- Dashboards for pipeline visibility
- Automation for activity capture
- AI-driven insights and nudges
Revenue Grid fits this approach by automating capture, surfacing insights, and sending actionable nudges right inside the rep’s workflow, turning tracking into daily guidance, not another chore.
How Revenue Grid Powers Sales Performance Tracking
Visibility gaps, inconsistent forecasts, and missing data often trace back to fragmented tracking. Revenue Grid brings everything together in one intelligent system.
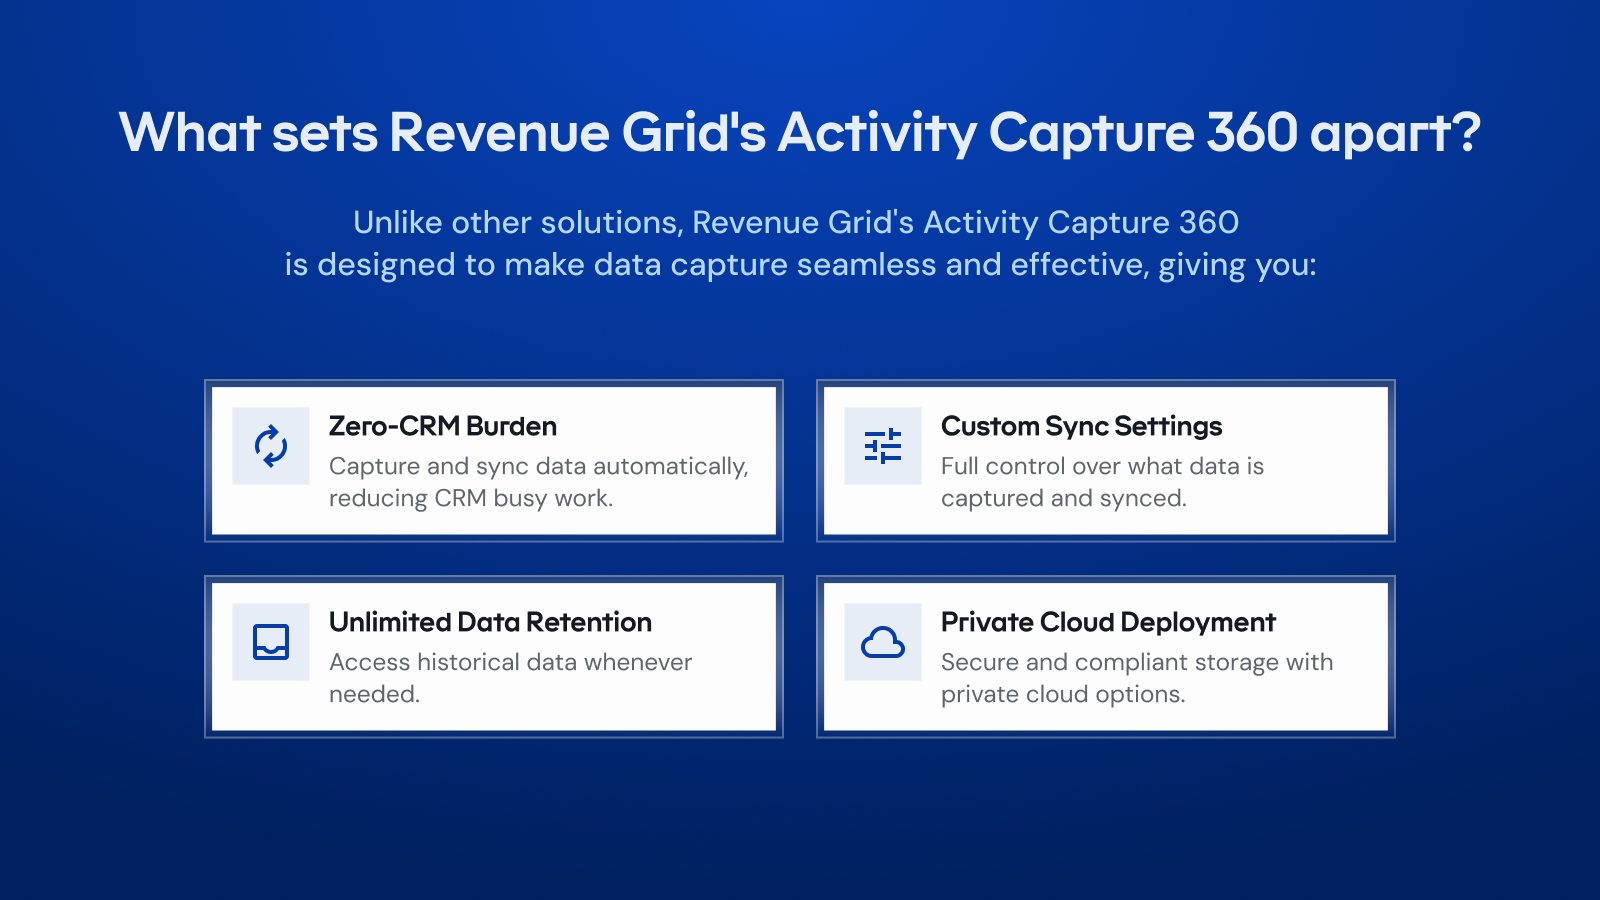
Automated Activity Capture: Every email, meeting, and call is logged directly to your CRM, creating a complete and trusted data record.
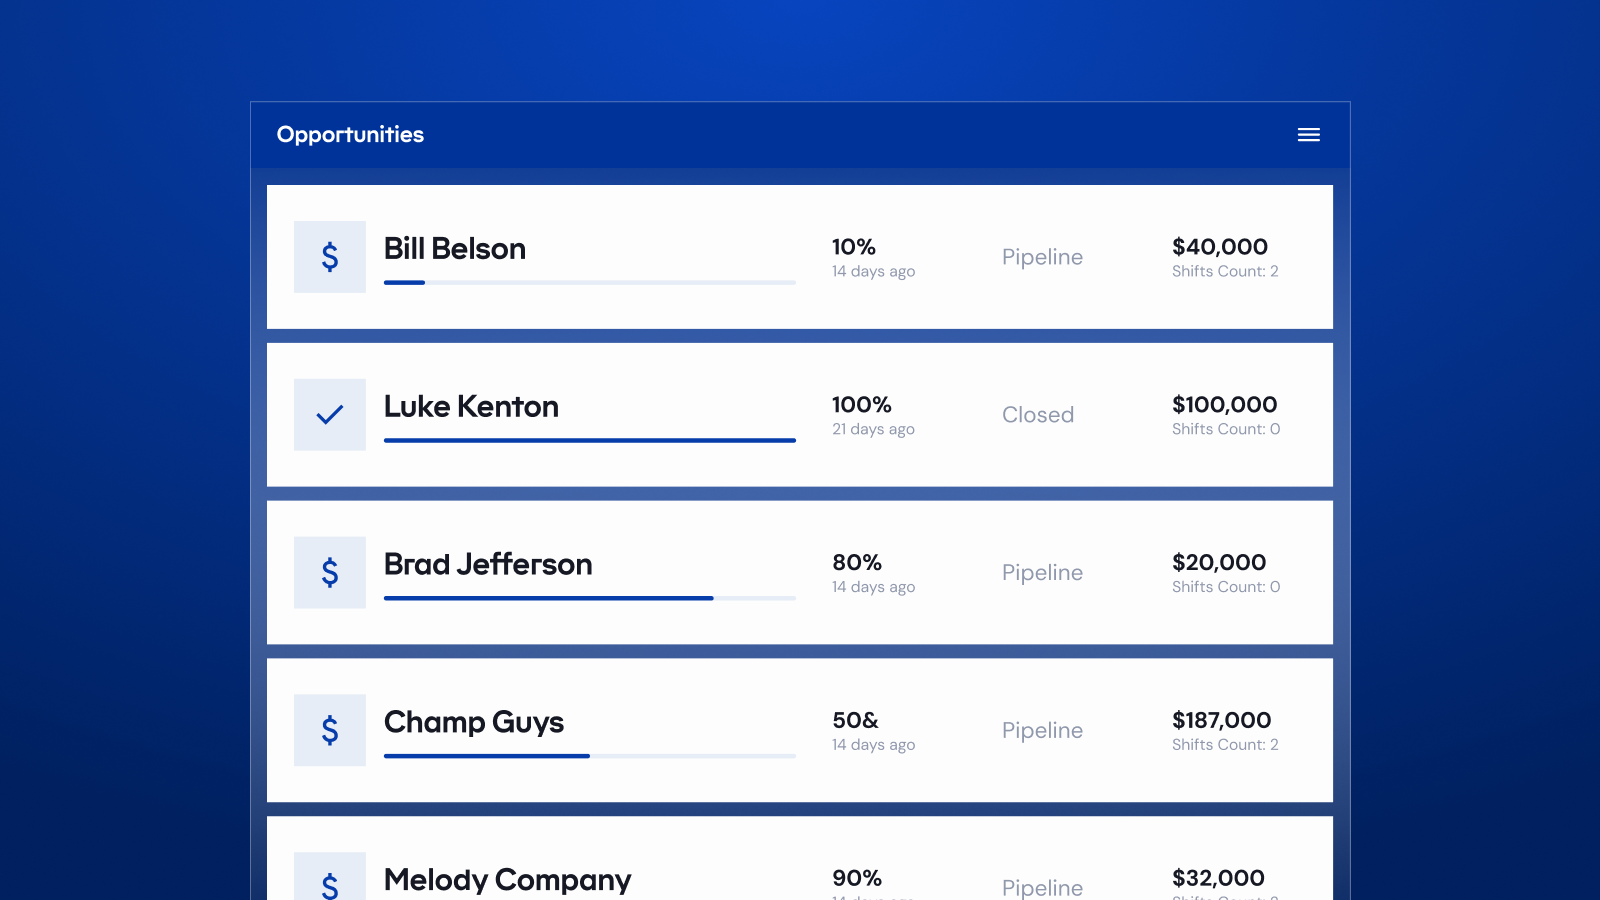
Real-Time Pipeline Visibility: View every deal’s health at a glance. Identify what’s progressing, what’s stuck, and where coverage needs reinforcement.

- Generative Signals: Intelligent nudges highlight at-risk deals, forecasting inconsistencies, and missed follow-ups before they hurt results.
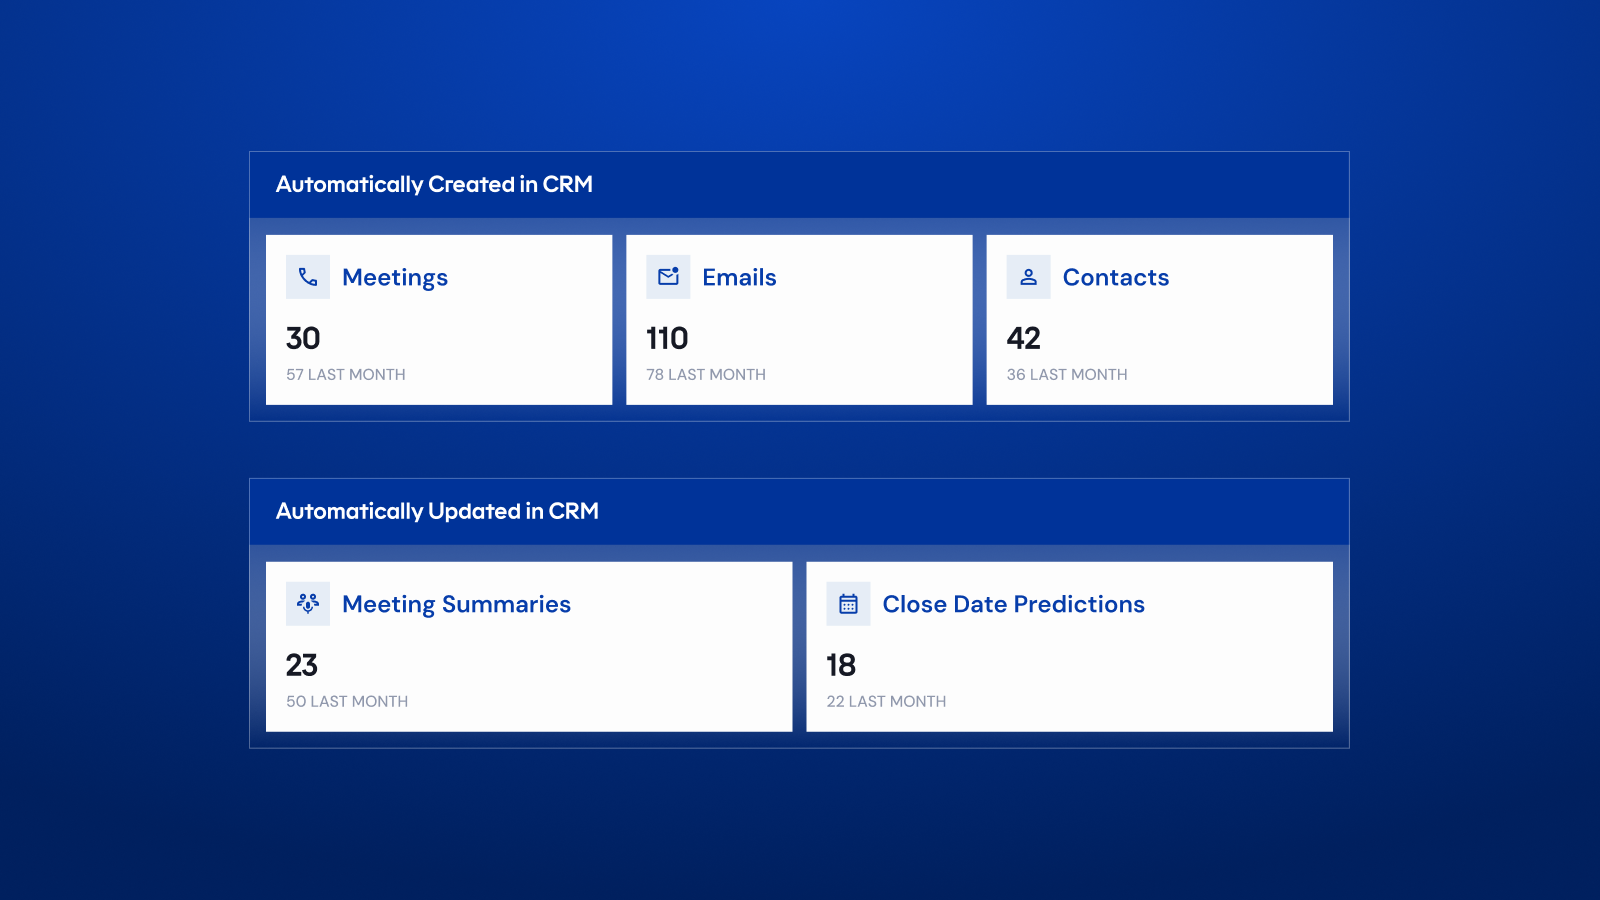
- AI Sales Assistant: Summarizes meetings, suggests next steps, and supports coaching with contextual recommendations.
- Revenue Leaks Funnel: Exposes where deals or revenue are slipping, giving managers a clear view of where to act.
By combining automation, analytics, and AI, Revenue Grid turns static dashboards into live, actionable insights, helping sales teams move from data collection to confident execution.
Ready to build more reliable forecasts and predictable revenue? Book a demo with Revenue Grid to see how intelligent tracking can help your team focus on what drives growth, not just what fills the dashboard.
What are the best practices for tracking sales performance?
Set clear KPIs, automate data capture, and review metrics weekly. Make insights visible across teams, not just within sales.
How can I improve adoption among sales reps?
Choose tools that integrate directly with your CRM and reduce manual work. When reps see real benefits, like faster follow-ups or fairer reviews, adoption follows naturally.
How often should teams review sales performance?
High-performing teams hold weekly reviews focused on pipeline health and forecast accuracy.
How soon can I see results from better tracking?
Most teams notice cleaner data, more accurate forecasts, and improved coaching within one quarter.
How does Revenue Grid improve deal visibility?
It automatically captures activities, flags risks, and highlights stalled deals, giving leaders a clear, real-time view of the pipeline without manual reporting.